5. Using Memory Dump Files to Analyze Stop Errors
Memory dump files
record detailed information about the state of your operating system
when the Stop error occurred. You can analyze memory dump files manually
by using debugging tools or by using automated processes provided by
Microsoft. The information you obtain can help you understand more about
the root cause of the problem.
You can use WER to upload
your memory dump file information to Microsoft. You can also use the
following debugging tools to analyze your memory dump files manually:
You can view information about the Stop
error in the System Log after a Stop error occurs. For example, the
following information event (with a source of Bugcheck and an Event ID
of 1001) indicates that a 0xFE Stop error occurred.
The computer has rebooted from a bugcheck.  The bugcheck was: 0x000000fe (0x00000008,
0x00000006, 0x00000001, 0x87b1e000). A dump was saved in: C:\Windows\MEMORY.DMP.
2.5.1. Using Windows Error Reporting
When enabled, the WER
service monitors your operating system for faults related to operating
system features and applications. By using the WER service, you can
obtain more information about the problem or condition that caused the
Stop error.
When a Stop error
occurs, Windows displays a Stop message and writes diagnostic
information to the memory dump file. For reporting purposes, the
operating system also saves a small memory dump file. The next time you
start your system and log on to Windows as Administrator, WER gathers
information about the problem and performs the following actions:
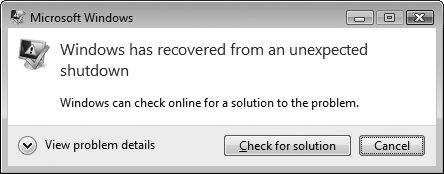
Windows displays the Windows Has Recovered From An Unexpected Shutdown dialog box, as shown in Figure 2.
To view the Stop error code, operating system information, and dump
file locations, click View Problem Details. Click Check For Solution to
submit the minidump file information and possibly several other
temporary files to Microsoft.
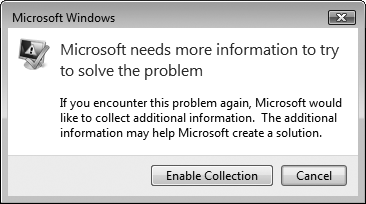
You might be prompted to collect additional information for future errors. If prompted, click Enable Collection, as shown in Figure 3.
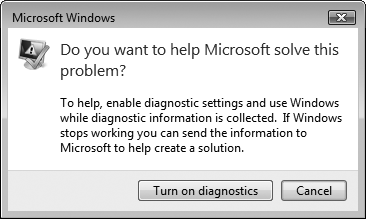
You might also be prompted to enable diagnostics. If prompted, click Turn On Diagnostics, as shown in Figure 4.
If
prompted to send additional details, click View Details to review the
additional information being sent. Then, click Send Information.
If prompted to automatically send more information about future problems, choose Yes or No.
When a possible solution is available, Action Center displays an icon in the system tray with a notification message.
Open Action Center to view the solution. Alternatively, you can search for View All Problem Reports in Control Panel.
If WER does not identify the
source of an error, you might be able to determine that a specific
driver caused the error by using a debugger, as described in the next
section.
5.2. Using Symbol Files and Debuggers
You can also analyze memory
dump files by using a kernel debugger. Kernel debuggers are primarily
intended to be used by developers for in-depth analysis of application
behavior. However, kernel debuggers are also useful tools for
administrators troubleshooting Stop errors. In particular, kernel debuggers can be used to analyze memory dump files after a Stop error has occurred.
A debugger
is a program that users with the Debug Programs user right (by default,
only the Administrators group) can use to step through software
instructions, examine data, and check for certain conditions. The
following two examples of kernel debuggers are installed by installing
Debugging Tools For Windows:
Kernel Debugger
Kernel Debugger (Kd.exe) is a command-line debugging tool that you can
use to analyze a memory dump file written to disk when a Stop message
occurs. Kernel Debugger requires that you install symbol files on your system.
WinDbg Debugger WinDbg Debugger (WinDbg.exe) provides functionality similar to Kernel Debugger, but it uses a graphical user interface (GUI).
Both tools allow users with the Debug Programs user right to analyze the contents of a memory
dump file and debug kernel-mode and user-mode programs and drivers.
Kernel Debugger and WinDbg Debugger are just a few of the many tools
included in the Debugging Tools For Windows installation. For more
information about these and other debugging tools included with
Debugging Tools For Windows, see Help in Debugging Tools For Windows.
To use WinDbg to analyze a crash dump, first install the debugging tools available at http://www.microsoft.com/whdc/devtools/debugging/.
To gather the most information from a memory dump file, provide the debugger access to symbol files. The debugger uses symbol
files to match memory addresses to human-friendly module and function
names. The simplest way to provide the debugger access to symbol files
is to configure the debugger to access the Microsoft Internet-connected
symbol server.
To configure the debugger to use the Microsoft symbol server, follow these steps:
Click
Start, point to All Programs, point to Debugging Tools For Windows,
right-click WinDbg, and then click Run As Administrator.
Select Symbol File Path from the File menu.
Click OK.
Debuggers do not require access to symbol files to extract the Stop
error number and parameters from a memory dump file. Often, the
debugger can also identify the source of the Stop error without access
to symbols.
Note:
You can also download symbol files for offline use from http://www.microsoft.com/whdc/devtools/debugging/.
To analyze a memory dump file, follow these steps:
Click
Start, point to All Programs, point to Debugging Tools For Windows,
right-click WinDbg, and then click Run As Administrator.
Select Open Crash Dump from the File menu.
Type the location of the memory dump file and then click Open. By default, this location is %SystemRoot%\Memory.dmp.
In the Save Workspace Information dialog box, click No.
Select the Command window.
As shown in Figure 5, the Bugcheck line tells you the Stop error number. The Probably Caused By line indicates the file that was being processed at the time of the Stop error.
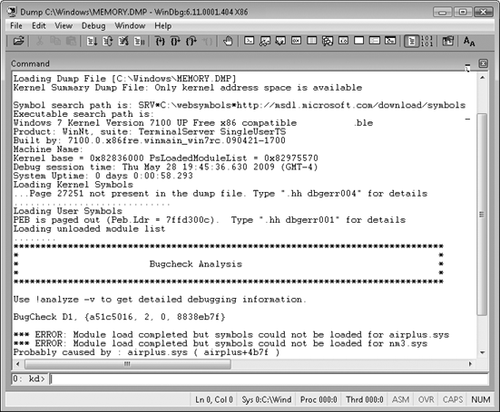
The Command window displays feedback from the debugger and allows you to issue additional commands. When a crash dump is opened, the Command window automatically displays the output of the !analyze command. In many cases, this default information is sufficient to isolate the cause of the Stop error.
If the default analysis does
not provide all the information you need for troubleshooting, run the
following command in the Command window.
!analyze -v
This command will display the stack,
which contains a list of method calls preceding the Stop error. This
might give clues to the source of a Stop error. For example, the
following stack trace output, created by calling !analyze –v,
correctly indicates that the Stop error was related to the removal of a
universal serial bus (USB) device, as shown by the bold text.
STACK_TEXT:
WARNING: Frame IP not in any known module. Following frames may be wrong.
ba4ffb2c ba26c6ff 89467df0 68627375 70646f52 0x8924ed33
ba4ffb5c ba273661 88ffade8 8924eae0 89394e48 usbhub!USBH_PdoRemoveDevice+0x41
ba4ffb7c ba26c952 88ffaea0 89394e48 00000002 usbhub!USBH_PdoPnP+0x5b
ba4ffba0 ba26a1d8 01ffaea0 89394e48 ba4ffbd4 usbhub!USBH_PdoDispatch+0x5a
ba4ffbb0 804eef95 88ffade8 89394e48 88eac2e0 usbhub!USBH_HubDispatch+0x48
ba4ffbc0 ba3f2db4 88eac228 88eac2e0 00000000 nt!IopfCallDriver+0x31
ba4ffbd4 ba3f4980 88eac228 89394e48 89394e48 USBSTOR!USBSTOR_FdoRemoveDevice+0xac
ba4ffbec b9eed58c 88eac228 89394e48 89394f48 USBSTOR!USBSTOR_Pnp+0x4e
