Windows 7 contains many other tools to discover
system information about your computer. Some of the tools you should be
familiar with include the following:
1. System Information
You can use the System Information utility, shown in Figure 1,
to show details about your hardware, software, and resources. Type
msinfo32 in the Windows 7 search box to launch this utility.
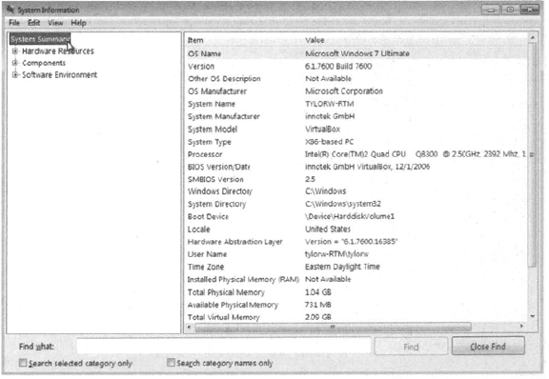
A great deal of
information is available about how to use this application. Click the
fields in the left pane, and details will be displayed in the right
pane. You can also search for a term by typing it in the Find What field
at the bottom of the page. This utility has been available in many
releases of the Windows product.
2. Task Manager
The Task Manager utility
shows the applications and processes that are currently running on your
computer, as well as CPU and memory usage information. To access Task
Manager, press Ctrl+Alt+Delete and click Start Task Manager,
Alternatively, right-click an empty area in the Taskbar and select Task
Manager from the context menu, or type task manager into the Windows 7
search box. The Task Manager dialog box has the following six main tabs
that I discuss in the sections that follow;
Applications
Processes
Services
Performance Networking
Users
2.1. Managing Application Tasks in Task Manager
The Applications tab of the Task Manager dialog box, shown in Figure 2,
lists all of the applications that are currently running on the
computer. For each task, you will see the name of the task and the
current status (running, not responding, or stopped).

To close an application, select
it in the Task Manager window and click the End Task button at the
bottom of the dialog box. To make the application window active, select
it and click the Switch To button. If you want to start an application
that isn't running, click the New Task button and specify the location
and name of the program you wish to start.
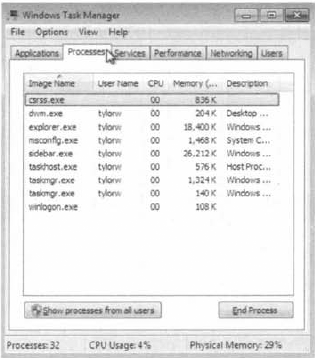
2.2. Managing Process Tasks in Task Manager
The Processes tab of the Task Manager dialog box, shown in Figure 3,
lists all the processes that are currently running on the computer.
This is a convenient way to get a quick look at how your system is
performing. For each process, you will see the Image Name (the name of
the process), the User Name (the user account that is running the
process), CPU (the amount of CPU utilization for the process),
Memory—Private Working Set (the amount of memory that is being used by
the process), and Description (a description of the process).
From the Processes tab, you can organize the listing and control processes as follows:
To organize the
processes, click the column headings. For example, if you click the CPU
column, the listing will start with the processes that use the most CPU
resources. If you click the CPU column a second time, the listing will
be reversed so the processes that use the least CPU resources are listed
first.
To
manage a process, right-click it and choose an option from the context
menu. You can choose to end the process, end the process tree, debug the
process, specify virtualization, create a dump file, or set the
priority of the process (to Realtime, High, Above Normal, Normal, Below
Normal, or Low), If your computer has multiple processors installed, you
can also set processor affinity (the process of associating a specific
process with a specific processor) for a process.
To customize the counters that are listed, choose View =>
Select Columns. This brings up the Select Columns dialog box, where you
can select various information you want to see listed on the Processes
tab.
Within the Processes tab in Task Manager, you can also stop a process and manage process priority.
Stopping Processes
You might need to stop a process that isn't executing properly. To stop
a specific process, select the process you want to stop in the Task
Manager's Processes tab and click the End Process button. Task Manager
displays a Warning dialog box. Click the End Process button to terminate
the process. If you right-click a process, you can end the specific
process or you can use the option End Process Tree. The End Process Tree
option ends all processes that have been created either directly or
indirectly by the process.
Managing Process Priority
You can manage process priority through Task Manager. To change the
priority of a process that is already running, use the Processes tab of
Task Manager. Right-click the process you want to manage and select Set
Priority from the context menu. You can select from Realtime, High,
Above Normal, Normal, Below Normal, and Low priorities. As you might
expect, applications launch at Normal priority by default.
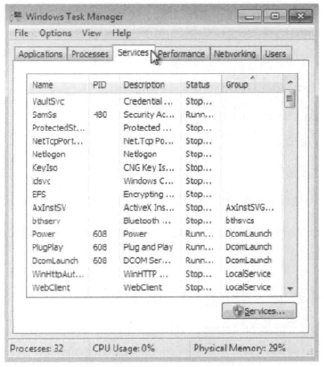
2.3. Managing Services in Task Manager
The Services tab of the Task Manager dialog box, shown in Figure 4,
lists all the services that can run on the computer. For each service,
you will see the Name (the name of the service), PID (the associated
process identifier), Description (a description of the service), Status
(whether a process is Running or Stopped), and Group (the service
group).
To start a stopped service,
click the service and select Start Service. To stop a running service,
click the service and select Stop Service. You can also open the
Services tool by clicking the Services button. The Services tool enables
you to specify whether a process starts automatically, automatically
with a delayed start, manually, or is disabled.
2.4. Managing Performance Tasks in Task Manager
The Performance tab of the Task Manager dialog box, shown in Figure 5,
provides an overview of your computer's CPU and memory usage. The
Performance tab is similar to the information tracked by Performance
Monitor.
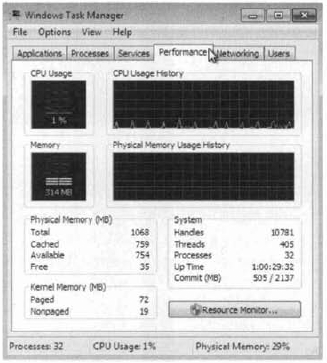
The Performance tab shows the following information:
CPU usage, in real time and in a history graph
Memory usage, in real time and in a history graph
Physical memory statistics
Kernel memory statistics
System totals for handles, threads, processes, uptime, and the page file
Click the Resource Monitor button to launch Resource Monitor, which you can also find in Performance Monitor.
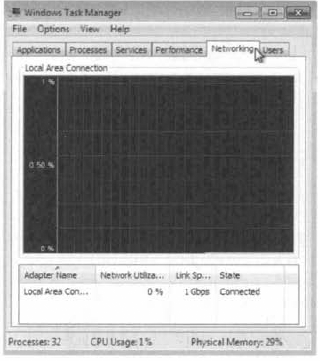
2.5. Managing Networking Tasks in Task Manager
The Networking tab of the Task Manager dialog box, shown in Figure 6, provides an overview of your networking usage. Statistics for each adapter are displayed at the bottom of the dialog box.
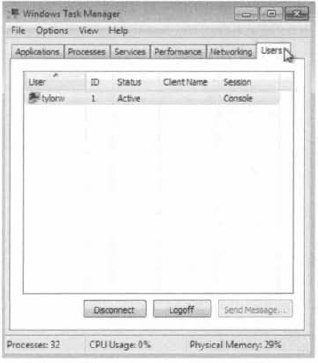
2.6. Managing Users in Task Manager
The Users tab of the Task Manager dialog box, shown in Figure 7,
shows the active and disconnected users on your computer. For each
user, you will see the User (the name of the user), ID (the current user
ID), Status (whether Active or Disconnected), Client Name, and Session
(whether the user is connected via the console session or by another
method, such as Remote Desktop).
To send a message to a user,
select the user and click the Send Message button. To connect to a user
session, right-click the user and select Connect. To disconnect a user
session, select the user and click the Disconnect button. To log off a
user, select the user and click the Logoff button.
In addition to msinfo32 and
Task Manager (taskman.exe), Windows 7 has another tool to show you how
well your machine is currently working: Performance Information and
Tools.
3. Performance Information and Tools
If you enjoy seeing how well
your computer performs by running benchmarking applications that provide
a score rating, then you will love Performance Information and Tools,
shown in Figure 8.
This utility provides a numerical score that lets you know how well
your system performs. To launch Performance Information and Tools, click
Start => Control Panel => System And Maintenance => Performance Information And Tools, or simply type Performance Information in the Windows 7 search box.
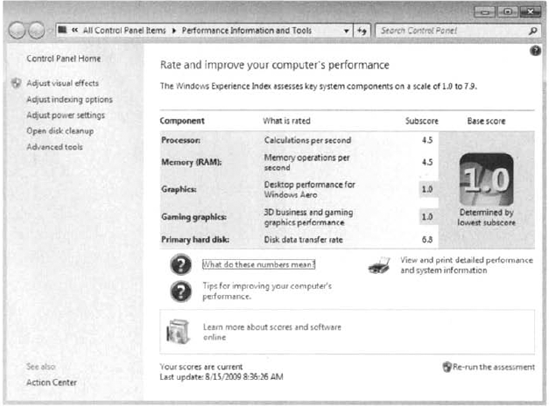
The main pane reveals a
calculated score, called the Windows Experience Index. The Windows
Experience Index base score is calculated by taking the lowest subscore
among five rated components:
Processor, based on calculations per second
Memory (RAM), based on memory operations per second
Graphics, based on Windows Aero performance
Gaming Graphics, based on 3D graphics performance
Primary Hard Disk, based on disk transfer rate
A computer with a base score of
1 or 2 will be able to perform only the most basic tasks. A base score
of 3 indicates that a computer can run Windows Aero and all but the most
advanced Windows 7 features. A base score of 4 or 5 should be able to
run all Windows 7 features, as well as play graphically intensive 3D
games.
Each component subscore
determines how well each individual component performs. Because the
base score is equal to the lowest component subscore, the Windows
Experience Index base score should give you an overview of how well your
computer should run applications. This enables application developers
to give their applications a numerical rating so consumers can easily
figure out whether the application will run well on their computer.
If an application requires a
higher base score than your computer has, it might be time to upgrade
your hardware. After you install new hardware, you can select Update My
Score to have Windows 7 recalculate your Windows Experience Index base
score.
The left pane
of Performance Information and Tools contains useful links to help you
improve the performance of your computer. Click Adjust Visual Effects to
bring up the Visual Effects tab of the Performance Options dialog box,
which you can use for configuring how Windows will graphically display
windows, menu items, and icons. Click Adjust Indexing Options to launch
Indexing Options, which can improve the speed of searching files on your
computer. Click Adjust Indexing Options to launch the Indexing Options
dialog box, where you can choose which resources on your Windows 7
machine are included in indexing.
Click Adjust Power Settings
to launch Power Options, which you can use to adjust your power plan.
Click Open Disk Cleanup to launch Disk Cleanup Options so you can clean
up unnecessary files on your hard disk. Finally, click Advanced Tools to
launch a list of tools that you can use to further improve your
computer's performance, including the following tools:
Clear all Windows Experience Index Scores and re-rate the system
View Performance Details in Event Log
Open Performance Monitor
Open Resource Monitor
Open Task Manager
View Advanced System Details in System Information
Adjust the Appearance and Performance of Windows
Open Disk Defragmenter
Generate a System Health Report
The Performance Information
And Tools menu is a great display of your system and a launching point
for many tools within Windows 7. Another useful tool that has been
around in many versions of Windows and is still available in Windows 7
is the System Configuration utility, or msconfig.
