2. Utilizing Customized Counters in Performance Monitor
You can add numerous counters
from any of the subsystems within Windows 7. To access the configurable
Performance Monitor window, select the Performance Monitor item in the
left pane, as shown in Figure 8.
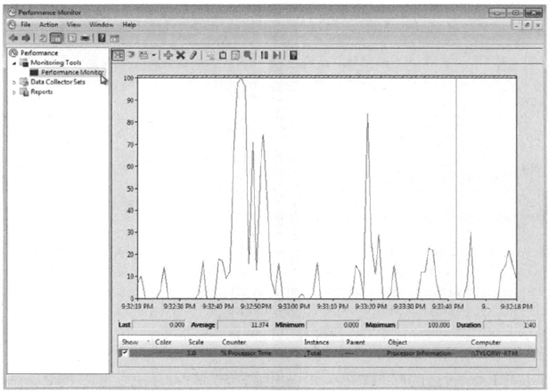
Customizable counters are
listed at the bottom of the Performance Monitor window. By default, only
the % Processor Time counter is tracked for the local computer. The
fields just above the counter list will contain data based on the
counter that is highlighted in the list, as follows:
Last Displays the most current data
Average Shows the average of the counter
Minimum Shows the lowest value that has been recorded for the counter
Maximum Shows the highest value that has been recorded for the counter
Duration Shows how long the counter has been tracking data
Before we add counters to Performance Monitor, we need to discuss the three Performance Monitor views.
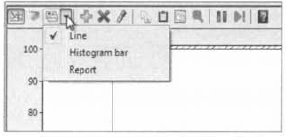
2.1. Selecting the Appropriate View
Click the Change Graph Type button on the Performance Monitor toolbar to see your data in one of three views, as shown in Figure 9.
Line View
The line view is Performance Monitor's default view. It's useful for
viewing a small number of counters in a graphical format. The main
advantage of line view is that you can see how the data has been tracked
during the defined time period.
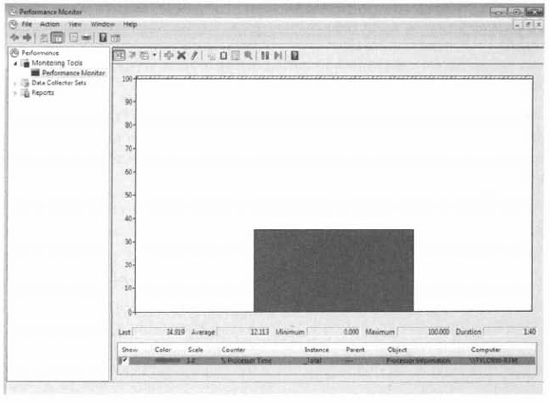
Histogram Bar View The histogram view, shown in Figure 10,
shows the Performance Monitor data in a bar graph. This view is useful
for examining large amounts of data. However, it shows performance only
for the current period. You do not see a record of performance over
time, as you do with the line view.
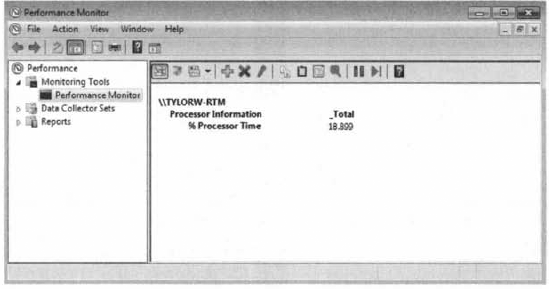
Report View The report view, shown in Figure 11,
offers a logical text-based report of all the counters that are being
tracked through Performance Monitor. Only the current session's data is
displayed. The advantage of the report view is that it allows you to
easily track large numbers of counters in real time. It is important to
note that when you view data in real-time format, the data can appear
skewed as applications and processes are started. It is typically more
useful to view data as an average over a specified interval.
Complete Exercise 1 to add counters.
In
Performance Monitor, click the Add button on the toolbar, which looks
like a green plus sign (+). This brings up the Add Counters dialog box. In
the Add Counters dialog box, ensure that the Select Counters From The
Computer drop-down list displays <Local Computer> so you can
monitor the local computer. Alternatively, to select counters from a
specific computer, pick a computer from the drop-down list. Select
a performance object from the drop-down list. All Windows 7 system
resources are tracked as performance objects, such as Cache, Memory,
Paging File. Process, and Processor. Select
the counter or counters within the performance object that you want to
track. Each performance object has an associated set of counters.
Counters are used to track specific information regarding a performance
object. For example, the PhysicalDisk performance object has a % Disk
Time counter, which will tell you how busy a disk has been in servicing
read and write requests. PhysicalDisk also has % Disk Read Time and %
Disk Write Time counters, which show you what percentage of disk
requests are read requests and what percentage are write requests,
respectively. Select <AII Instances> to track all the associated instances or pick specific instances from the list box. Click the Add button to add the counters for the performance object. Repeat steps 2 through 6 to specify any additional counters you want to track. When you finish, click OK.
|
After you've added counters,
you can select a specific counter by highlighting it in Performance
Monitor, To highlight a counter, click it and then click the Highlight
button (which looks like a highlighter) on the Performance Monitor
toolbar, or select the counter and press Ctrl+H.
To stop showing data for a
counter, deselect the check box under Show for that counter, To remove a
counter, highlight it in Performance Monitor and click the Delete
button on the toolbar. The Delete button looks like a red X.
3. Managing Performance Monitor Properties
To configure the
Performance Monitor properties, click the Properties button on the
Performance Monitor toolbar, and the Performance Monitor Properties
dialog box opens, as shown in Figure 12.
The Performance Monitor
Properties dialog box has the following five tabs—General, Source, Data,
Graph, and Appearance. You can configure the following properties on
each of these tabs:
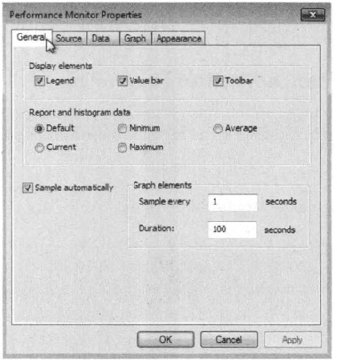
General Tab The General tab of the Performance Monitor Properties dialog box, as shown in Figure 13, contains the following options:
The display elements that will be used: legend, value bar, and/or toolbar
The
data that will be displayed: default (for reports or histograms, this
is current data; for logs, this is average data), current, minimum,
maximum, or average
How often the data is updated, in seconds
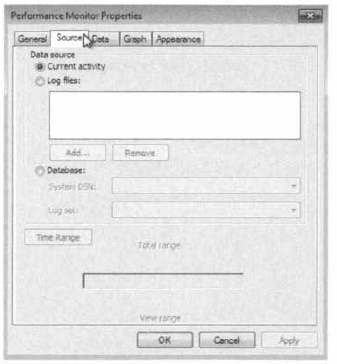
Source Tab The Source tab, shown in Figure 14,
enables you to specify the data source. This can be current activity,
or it can be data that has been collected in a log file or database. If
you import data, you can specify the time range that you want to view.
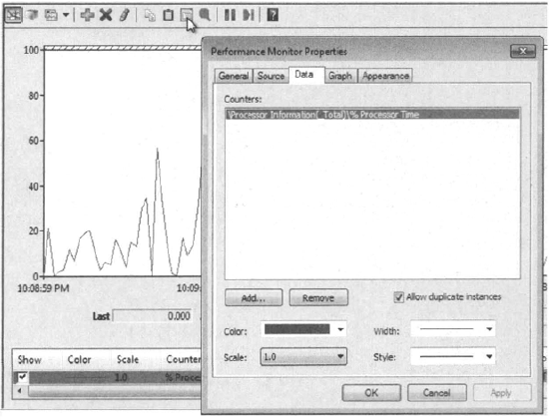
Data Tab
The Data tab (the default tab, which is active when the Properties
dialog box opens) lets you specify the counters that you want to track.
You can add and remove counters by clicking the Add and Remove buttons.
You can also select a specific counter and define the color, scale,
width, and style that are used to represent the counter in the graph.
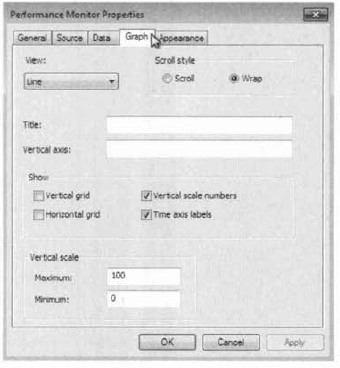
Graph Tab The Graph tab, shown in Figure 15, contains the following options, which you can apply to the line or histogram bar view:
Whether the data will scroll or wrap (line view only)
A title
A vertical axis label
Whether you will show a vertical grid, a horizontal grid, vertical scale numbers, and/or time axis labels
The minimum and maximum numbers for the vertical scale
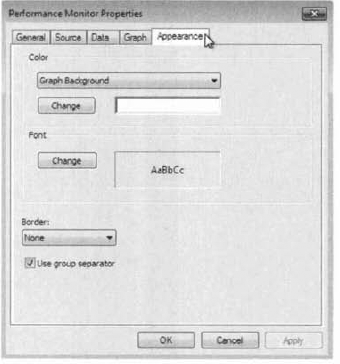
Appearance Tab The Appearance tab of the Performance Monitor Properties dialog box, shown in Figure 16, has options for customizing the colors and fonts used in the Performance Monitor display.
After you have set
counters and viewed them in real time, you might be interested in
collecting the data over time and saving it to a file so you can
maintain a baseline of data for comparison. You do this in Performance
Monitor by using data collector sets.
