Hosting WCF Services in Internet Information Services
Host applications for
WCF services can be of different kinds. Other than the ASP.NET
Development Server, you can host services inside managed applications,
Windows services, and Internet Information Services as well. In most
cases the need will be to deploy to IIS so we will cover this scenario.
To host your WCF service in IIS on your development machine, follow
these steps:
1. | Restart Visual Studio 2010 under administrator privileges.
|
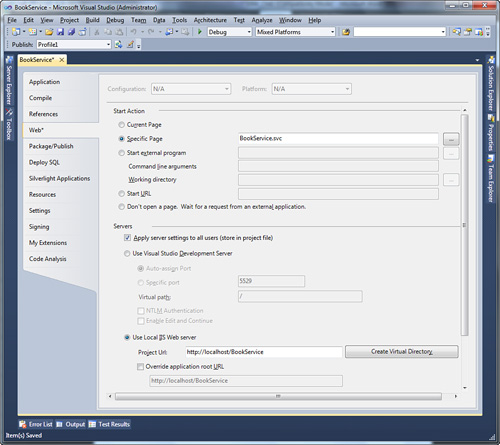
2. | Go to the My Project designer for the WCF service project and select the Web tab.
|
3. | Check the Use Local IIS Web Server option and specify, if required, a different directory; then rerun the WCF service (see Figure 1).

|
Visual Studio will request
your permission for creating and configuring a virtual directory on IIS
so you just need to accept. When this is done, remember to replace the
endpoint address
in the client application configuration file with the new service URI.
To host a WCF service on a nondevelopment machine, you need to create a
directory under the Default Website and link the physical folder to the
folder where the .svc file is placed together with the compiled dll
service. This is accomplished via the Internet Information Services
Manager administrative tools available in the Windows operating system.
Configuring Services with the Configuration Editor
WCF services enable
high-level customizations over their configuration. This task can be
complex if you consider that there are hundreds of options that you
should translate into Xml markup. Fortunately the .NET Framework offers a
graphical tool called WCF Service Configuration Editor that you can
also launch from the Tools menu in Visual Studio. In this section you
see how this tool can be used for enabling tracing for WCF services.
Tracing is useful because it enables recording into log file (with
.svclog extension) events occurring during the WCF service running time.
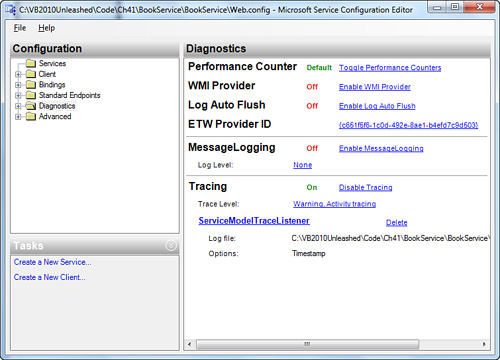
When launched, open the Web.config file for your service. When ready click the Diagnostics folder on the left and then click the Enable Tracing command under the Tracing title on the right (see Figure 2).

By default tracing records messages classified at least as warnings. To modify this behavior simply click the Trace Level link. If you click the ServiceModelTraceListener
link you can also specify additional information to be tracked, such as
the process ID, the call stack, and the Thread ID. To view the log of
recorded information you need to run the Service Trace Viewer tool that
is available in the shortcuts folder for Visual Studio in the Windows’
All Programs menu. When the tool is running, open the .svclog file,
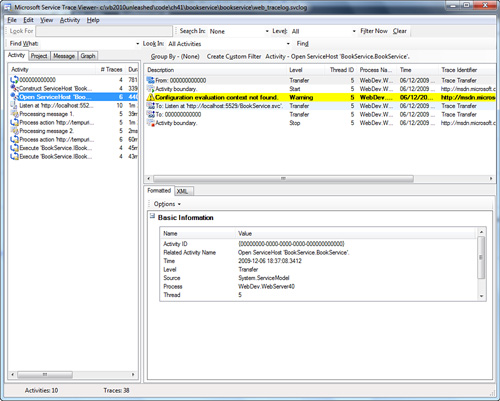
which usually resides in the service folder. Figure 3 shows an example of log analysis.

The tool provides tons of
information about every event occurring at the service level and is
helpful if you encounter any problems.