1. Problem
You have business users
requesting metrics, visibility, and business data from the execution of a
deployed BizTalk solution and the associated artifacts. The business
users are interested when any of the BizTalk processes execute the
following steps: process begins, process ends, or process encounters
exceptions. The business users are also interested in the following
attributes of the messages consumed by the BizTalk processes: the
transaction ID and transaction type.
2. Solution
This recipe outlines how to use
Excel to create a BAM workbook that tracks milestones and business data
for reporting. This recipe addresses the four categories of steps
required in creating a BAM solution. Each category of steps plays an
integral role in developing a useful, rich, and powerful BAM solution:
Creating the BAM activity workbook
Outlining the BAM view
Identifying aggregations, dimensions, and measures
Constructing the pivot table
NOTE
This recipe does not
address how to use the Orchestration Designer for business analysts or
the Tracking Profile Editor.
2.1. Create the BAM Activity Workbook
BAM activities identify the milestones and tracking data an individual is interested in tracking. Milestones are the steps in an activity that are measured in time, and tracking data is the key data points in a process you are interested in tracking (such as a customer ID or name).
This category of steps
outlines how to create a BAM activity in Excel. The activity defined in
this recipe includes milestones that indicate when a process begins,
ends, and encounters an exception. Additionally, the following steps
outline how to create tracking data that captures the transaction ID and
transaction type.
NOTE
All references in this
recipe to Excel refer to Excel 2010. Previous versions of Excel will
have slight variations to the steps outlined (the most obvious is that
BAM is available on the main toolbar as opposed to showing under the
Add-ins tab). Note that with the early version of BizTalk 2010, some
errors could occur when using Excel 2010. If errors occur for you (such
as the inability to save a workbook), roll back to using an earlier
version of Excel.
Create
a new Excel workbook, select the BAM menu item, and choose BAM
Activity. Choosing the BAM activity will launch the Business Activity
Monitoring Activity Definition Wizard.
NOTE
If the BAM menu item is an Excel add-in, the easiest way to get the BAM functionality is to start with a copy of the file named BAM.xla located in the ExcelDir of the root BizTalk Server 2010 directory.
In
the Business Activity Monitoring Activity Definition Wizard, click the
New Activity button to create a new activity. Name the new activity
Process Activity.
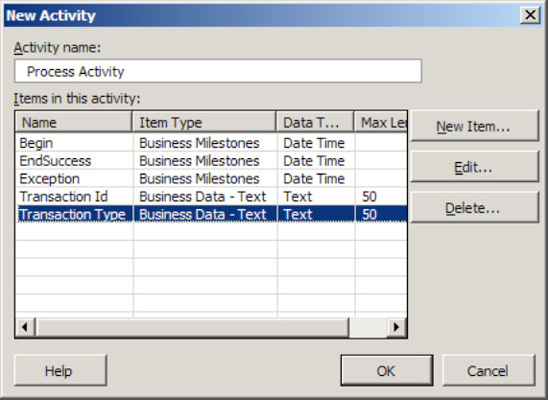
Create the items listed in Table 1
for your activity, and click the OK button to complete the Business
Activity Monitoring Activity Definition Wizard. The completed activity
should resemble Figure 1.
Table 1. Activity Milestones and Key Tracking Data Items
| ID | Item Name | Item Type | Data Type | Description |
|---|
| 1 | Begin | Business Milestones | Date Time | Identifies the date/time a process begins |
| 2 | EndSuccess | Business Milestones | Date Time | Identifies the date/time a process successfully ends |
| 3 | Exception | Business Milestones | Date Time | Identifies the date/time a process exception occurs |
| 4 | Transaction Id | Business Data – Text | Text (50) | Identifies the ID of the transaction being processed |
| 5 | Transaction Type | Business Data – Text | Text (50) | Identifies the type of the transaction being processed |
Click the OK button twice to complete the wizard and create a BAM view.
2.2. Outline the BAM View
A BAM view is a representation
of the milestones and business data tracked in one or more activities. A
view may comprise multiple activities or multiple milestones from a
single activity and can contain tracked data or milestones as well as
provide aggregations or summaries of the tracked milestones and business
data. Creating a BAM view is a necessary step because it defines which
tracked milestones and business data to report. Typically, different
views are created to show multiple audiences different aspects of the
same tracked data.
This category of
steps demonstrates how to outline your view and display tracked data
items and milestones. The view created in this recipe summarizes how
many processes execute successfully versus how many processes encounter
an exception.
When
the Business Activity Monitoring View Creation Wizard begins, click the
Next button to advance the wizard and create a new view.
NOTE
If the wizard does not start, launch it by selecting BAM View from the BAM menu in the Add-ins section of Excel.
Name
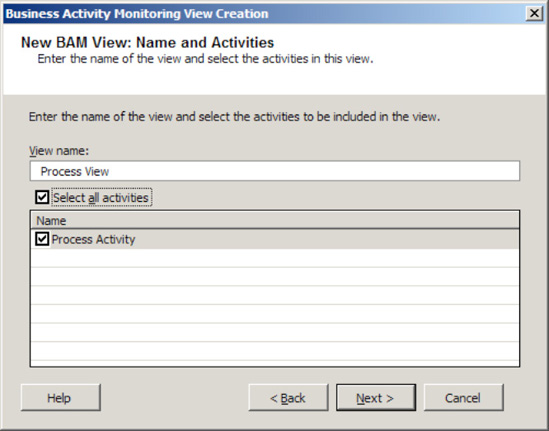
the view Process View, and select the Select All Activities box. The
Business Activity Monitoring View Creation Wizard will resemble Figure 2. Click the Next button to advance the wizard.
On
the New BAM View: View Items page of the Business Activity Monitoring
View Creation Wizard, select the Select All Items box to add all the
milestones and business data to the new view. Click the Next button to
advance the wizard.
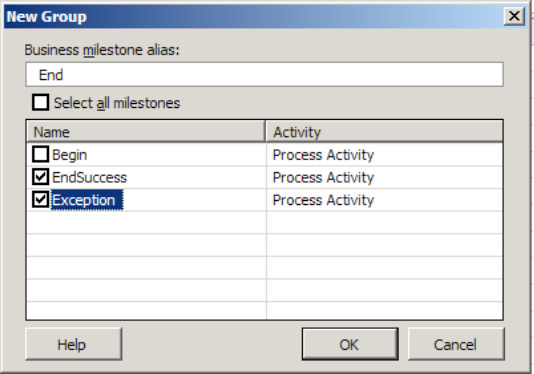
Click the New Group button to create a Group item, and select the box next to the milestones listed in Table 2. Figure 3 demonstrates the milestones to select.
NOTE
The Group milestone
allows related milestones to be treated as a single milestone. In this
example, grouping the EndSuccess and Exception milestones is useful to
indicate the completion of the process regardless of whether it
completed successfully or failed.
Table 2. Business Milestone Group
| Business Milestone Alias | Name | Activity |
|---|
| End | EndSuccess | ProcessActivity |
| | Exception | ProcessActivity |
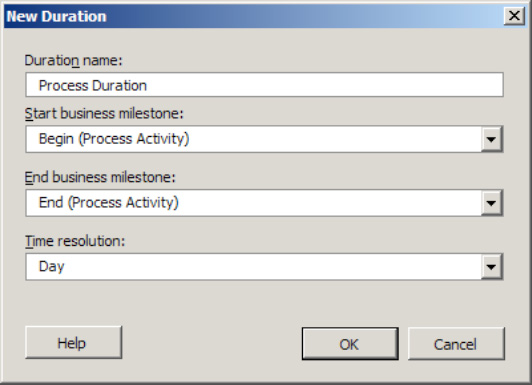
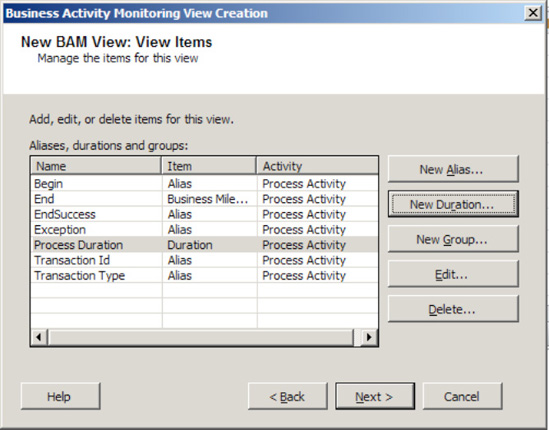
Create a New Duration item with the parameters listed in Table 3 to record the total process execution time. Figure 4 demonstrates the New Duration creation dialog box.
NOTE
A duration
calculates the time between two business milestones and is useful when
reporting the time elapsed between two milestones is important. In this
sample, the duration will display the time elapsed for the process
execution from the beginning of the process to the End milestone group
created earlier.
Table 3. Duration Properties
| Duration Name | Start Milestone | End Milestone | Time Resolution |
|---|
| ProcessDuration | Begin (Process Activity) | End (Process Activity) | Day |
The completed Business Activity Monitoring View Creation Wizard should resemble Figure 5. Click the Next button to advance the wizard and create aggregations, dimensions, and measures.
NOTE
All names used for aliases, durations, groups, dimensions, and measures must be unique for a single view.
2.3. Identify Aggregations, Dimensions, and Measures
Aggregations,
dimensions, and measures in your BAM solution provide rich functionality
for deriving computations and information based on the tracked data and
milestones. This category of steps is not required; however, it adds
richness to a BAM solution. After completing this category of steps, you
must also complete the steps outlined in the "Construct the Pivot Table" section to organize the derived results.
Click the New Dimension button and create a new progress dimension. Name it ActivityProgress.
NOTE
A progress dimension
defines milestones and stages for a process. A progress dimension
allows you to display how many processes are at an existing status at a
given time. In this example, a progress dimension will display how many
processes are in the middle of execution, how many encountered an
exception, or how many processed without an exception. Table 4 lists the milestones and stages created in this example.
Table 4. Progress Dimension Items
| Milestone/Stage Name | Description |
|---|
| Started | The
process begins as soon as a message is received. Started is a
milestone, and each progress dimension must contain a milestone. |
| Processing | Processing is a transient stage and indicates a transition from when the process started to when it completes. |
| Completed | Completed is a milestone indicating the process has successfully completed. |
| Failed | Failed is a milestone indicating the process has failed to complete because of an exception. |
NOTE
When defining a progress dimension, you must define the steps in your process and the transitions between the steps. Milestones define the steps, and stages define the transitions between milestones. Each progress dimension must begin with a milestone.
The following instructions detail how to create the items listed Table 4:
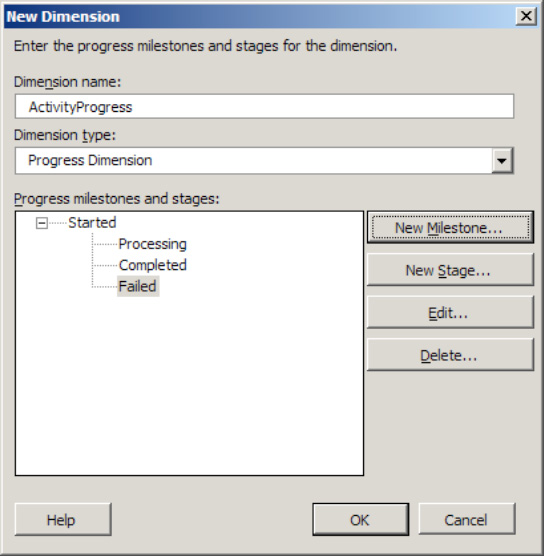
Click the New Milestone button to launch the New Progress Milestone dialog box. Create a new milestone, name it Started, and make it refer to the business milestone called Begin (Process Activity).
Click the New Stage button to launch the New Progress Stage dialog box. Create a new stage named Processing. You will not be able to select the business milestone, because the wizard automatically selects the milestone.
Click the New Milestone button to launch the New Progress Milestone dialog box. Create a new Milestone named Completed, and make it refer to the business milestone called EndSuccess (Process Activity).
Click the New Milestone button to launch the New Progress Milestone dialog box. Create a new Milestone named Failed, and make it refer to the business milestone called Exception (Process Activity).
Figure 6 demonstrates the completed progress dimension. Click the OK button to complete the New Dimension dialog box.
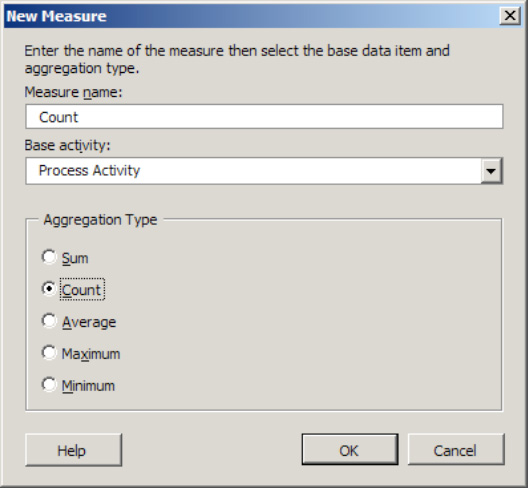
Create a new measure with the properties listed in Table 5. A new measure will provide a count of processes currently executing. Click OK to complete the New Measure dialog box. Figure 7 demonstrates the New Measure dialog box.
Table 5. Measure Properties
| Measure Name | Base Data Item | Aggregation Type |
|---|
| Count | Process Activity | Count |
NOTE
You must select Count as an aggregation type before you can select Process Activity as the base date item.
Click the Next button to complete the New BAM View: Aggregation Dimension and Measures page of the wizard.
Review
the contents of the New BAM View: Summary page of the Business Activity
Monitoring View Creation Wizard. Click the Next button, and finally,
click the Finish button to complete the wizard.
NOTE
At this point,
you have successfully created a BAM activity and view (including
aggregations, measures, and dimensions). The next step is to complete
the pivot table layout for the BAM view.
2.4. Construct the Pivot Table
This final category of steps
demonstrates how to lay out the computed items created in the earlier
category of steps. If you did not complete the previous category of
steps, you will not be presented with the option of creating a pivot
table. The pivot table created in this recipe appears in the BAM portal
and is the representation of the data for the user. An Excel pivot table
allows you to lay out worksheet data in a grid to analyze trends over
data as well as perform data aggregations. In this scenario, the
progress dimension previously created is organized in the pivot table
alongside the count measure also previously created.
After completing
the Business Activity Monitoring View Creation Wizard, you will have a
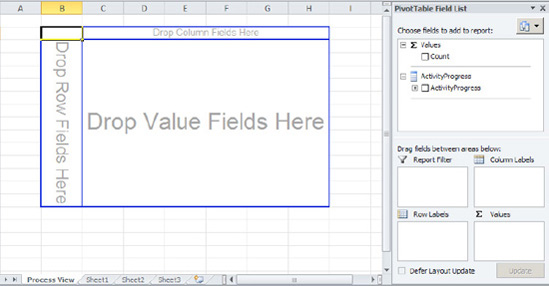
workbook with an empty pivot table that resembles Figure 8.
The image displays the empty Pivot Table report and the Pivot Table
Field List window. Data items from the Pivot Table Field List window are
organized in the Pivot Table report.
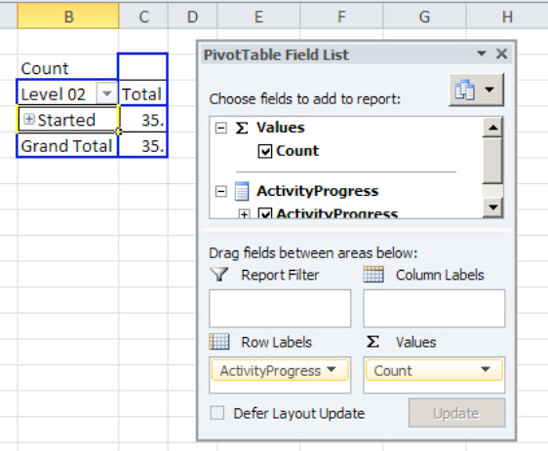
In
Excel, drag the ActivityProgress dimension from the Pivot Table Field
List window onto the Drop Row Fields Here section of the pivot table.
From
the Pivot Table Field List window, drag the Count item to the Drop
Value Fields Here section of the pivot table. The pivot table should
resemble Figure 9.
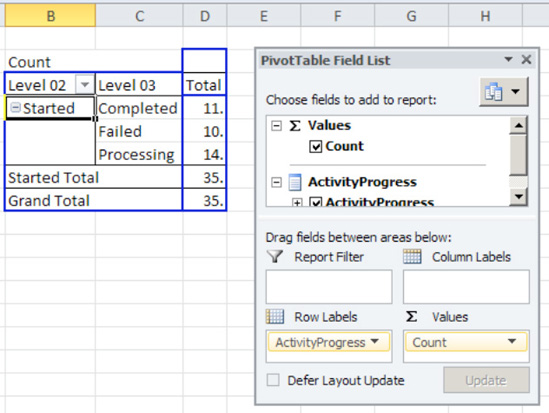
This
step demonstrates how to expand the progress dimension to see all the
defined stages and milestones. Double-click the Started milestone to
expand and see the stages and milestones within the progress dimension.
The completed pivot table will resemble Figure 10.
NOTE
If you receive an error
message, verify that you clicked inside the Started milestone cell
first before double-clicking the started milestone.
Mark
the pivot table as a real-time aggregation by clicking the Real-Time
Aggregation button in BAM add-ins area of the Excel toolbar ribbon. Figure 11 shows where the Real-Time Aggregation button is located.

Save the workbook when you are finished.
3. How It Works
BAM is a flexible
framework to expose key metrics about business processes modeled within
BizTalk. Creating a BAM solution using the BizTalk tool set is a
straightforward process requiring little custom development. As outlined
earlier, creating and deploying a BAM solution requires four basic
categories of steps.
3.1. Create the BAM Activity Workbook
The first category of steps
in creating a BAM solution is defining the structure for recording data
about a BizTalk process. The structure for recording process data is
created in an Excel workbook via the BAM add-in tool. The workbook
captures key performance indicators or milestones as defined by the user
as well as defines how a user views the milestones. Keep in mind that
the Excel workbook is independent from any of the BizTalk solution
artifacts and serves only as a container for recording information and
computing aggregations.
Using the BAM Excel
workbook removes the need for the user to have familiarity with the
physical BizTalk solution artifacts. In actuality, the user may be more
interested in a logical process implemented through multiple BizTalk
artifacts versus the specifics for a single artifact. Consider when you
tell someone about a trip you have taken. Do you relay the highlights of
the trip or all the travel details (such as flight number, gas station
fill-ups, and so on)? The BAM workbook allows the user to specify the
BizTalk process highlights to monitor.
NOTE
As previously
mentioned, the BAM workbook is an integrated add-in tool within Excel.
If you have the BAM add-in tool enabled, you will be able to work on
only a single Excel workbook at a time. If you try to open multiple
workbooks, you will receive an Excel alert stating you cannot have
multiple workbooks for the single Excel instance at the same time.
However, you can open a new instance of Excel if you need multiple
workbooks opened at the same time. Figure 12 shows the Excel exception alert.

After creating the BAM workbook,
the next step is to identify the key data items, milestones, or key
performance indicators implemented through data aggregations. Again,
keep in mind that the milestones are logical markers and are not tied
directly to physical BizTalk artifacts. For example, a milestone could
signify the start or completion of a process. After creating the
milestone and deploying the workbook, you map the multiple BizTalk
artifacts to that milestone or data item. A BAM activity is a reference
to a group or collection of milestones or data items and can span
multiple BizTalk artifacts. Table 6
describes the four types of items that can be created in a BAM
activity. Please review the "Considerations" section of this recipe for
additional information about relating multiple activities and grouping
of activity items.
Table 6. BAM Activity Items
| Milestone | Name | Description |
|---|
| 1 | Business Data – Milestone | Placeholder for a date/time marker. Use this type of milestone when interested when an event occurred. |
| 2 | Business Data – Text | Placeholder
for a text type of data item. Use this type of milestone when reporting
a specific textual value piece of data (such as a promoted property)
that is a textual value. |
| 3 | Business Data – Integer | Placeholder
for an integer type of data item. Use this type of milestone when
reporting a specific number piece of data (such as a transaction ID). |
| 4 | Business Data – Decimal | Placeholder
for a decimal type of data item. Use this type of milestone when
reporting a specific piece of data requiring decimal precision (such as a
dollar amount). |
3.2. Outline the BAM View
After defining the BAM
activity structure and necessary milestones, the next step is creating
the view that will represent the tracked data items and milestones. The
BAM view is a representation of the milestones and business data defined
in a single activity or multiple activities. Views can contain both
data and computed aggregations based on the data.
The BAM view also
facilitates the creation of data aggregations. If you have distinct
audiences interested in different data aggregations or representations
of activity milestones, then using a BAM view to represent those views
is advantageous. Additionally, you can restrict BAM views to specific
audiences to limit the viewing of sensitive data or milestones. You can
create a BAM view in one of two ways: using the Business Activity
Monitoring View Creation Wizard or from the BAM add-in menu.
An optional task in
creating a BAM view involves creating the necessary alias, duration, and
group view items. These items are not required but offer extended
desirable functionality to a BAM view. Consider view items as computed
milestones that show the grouping of items or time durations between two
milestones. Table 7 describes each view item.
Table 7. BAM Computation Milestones
| ID | Name | Description |
|---|
| 1 | Alias | Allows the referencing of a previously created milestone. |
| 2 | Duration | Allows
the monitoring of a span of time between two date/time milestones. For
example, if you have a milestone for when a process begins and a
milestone for when a process completes, you can create a duration
milestone to report the time difference between the two milestones. The
duration milestone will report on the following time scale (day, hour,
minute, or second). |
| 3 | Group | Creates
a new milestone for grouping of milestones into a single point in time.
For example, if you have a milestone indicating when a process
completes successfully or when a process fails, you could create a group
milestone that indicates a process finished and group the process
completes and process fails milestones. The composite or grouped
milestone would identify when a process completed regardless of whether
it completed or failed. Another common use is in the situation that you
have a process that could fail at multiple points and you want to group
all failures into a single process failed milestone. |
3.3. Identify Aggregations, Dimensions, and Measures
Also optional when creating a
BAM view is the inclusion of aggregations, dimensions, and measures
based on the milestones and data items tracked. In this example, you
created a measure to track the count of processes. Additionally, you
created a progress dimension to show the progress of the process as it
executes. These items are not required but offer additional flexibility
to a BAM view.
3.4. Construct the Pivot Table
The final category of steps
involves laying out the items of your view into a pivot table for
reporting. In this recipe, you created a pivot table that displays the
progress of your solution and aggregations of that process through a
progress dimension, aggregations, and measures.
3.5. Activity Grouping and Multiple Processes
If you have an interest in
categorizing multiple milestones into a single group, you should look at
using activity grouping. Considering the milestones to be included in
an activity and considering the scope of the activity can be
challenging. A single activity can reference multiple activities;
however, it may also make sense (depending on the level of detail) to
create a single activity with the necessary milestones. Again, imagine a
trip with multiple legs and side trips containing many details. If the
user is interested in many details about the overall trip as well as the
individual legs of the trip, it may make sense to create multiple
activities to represent the trip as a whole as well as the individual
trip legs. Alternatively, if the user is interested only in the trip
highlights, it may make sense to create a single activity with those
highlights for the entire trip (including trip legs).
In the recipe sample,
milestones indicate when a process begins, ends, encounters an
exception, and defines data characteristics about the processed
transaction. Typically, these milestones include enough information for a
user interested in a high-level view about the health of a business
process.
Also think about the number
of processes. In this example, you created a single activity to report
on the behavior of a business process. If you create a solution that has
multiple related processes, you may need to create and relate multiple
activities. Creating related activities is also necessary in situations
where you have a process that involves a looping structure (such as an
orchestration with a loop). In the situation where you have a loop
structure in an orchestration, you would create one activity for the
orchestration and an additional activity for the events occurring within
the loop. The physical act of relating activities occurs in the
Tracking Profile Editor (or via code).
NOTE
When creating
related activities, verify that the activities are included in the same
BAM view. Additionally, verify that a shared attribute (for example, MessageID) relates the two activities.