The tools available with SSMS can be broadly
categorized into tools that are used for administering SQL Server and
tools that are used for developing or authoring new SQL Server objects.
As a matter of practice, developers use some of the administrative
tools, and administrators use some of the development tools.
SSMS comes with an expanded
set of tools to help with SQL Server administrative tasks. It builds on
the functionality that was available in SQL Server 2005 and adds some
new tools and functionality to help ease the administrative burden.
Registered Servers
Registered servers is a
concept in SQL Server 2008 that represents a division between managing
servers and registering servers. With the SQL Server 2000 Enterprise
Manager, the Microsoft Management Console (MMC) tree was displayed on
the left side of the Enterprise Manager screen, and it contained servers
that had been registered via that tree. Any registered servers or
groups were listed in the tree, along with any of the associated
objects.
Registered servers are managed and displayed in the Registered Servers component window. Figure 0
shows an example of the Registered Servers window, with several server
groups and their associated registered servers. You can add new groups
or servers any time so that you have a handy way of organizing the
servers you work with.
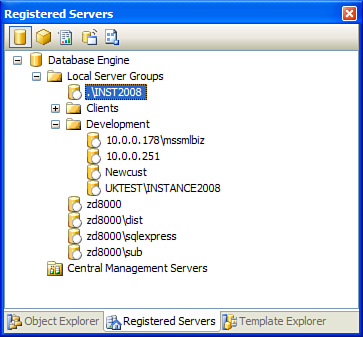
The servers listed in Figure 4.5
are all Database Engine servers. These server types are the
conventional SQL Server instances, like those you could register in the
SQL Server 2000 Enterprise Manager. You can also register several other
types of servers. The icons across the top of the Registered Servers
window indicate the types of servers that can be registered. In addition
to Database Engine servers, you can also register servers for Analysis
Services, Reporting Services, SQL Server Mobile, and Integration
Services. The Registered Servers window gives you one consolidated
location to register all the different types of servers available in SQL
Server 2008. You simply click the icon associated with the appropriate
server type, and the registered servers of that type are displayed in
the Registered Servers tree.
Note
The SQL Server 2008
Registered Servers window enables you to register servers that are
running SQL Server 2005, SQL Server 2000, and SQL Server 7.0. You can
manage all the features of SQL Server 2005 and SQL Server 2000 with SQL
Server 2008 tools. You can also have both sets of tools on one machine.
The SQL Server 2000, SQL Server 2005, and SQL Server 2008 tools are
compatible and function normally together.
Management tools from prior
SQL Server versions cannot be used to manage SQL Server 2008 instances.
For example, the SQL Server 2000 Enterprise Manager cannot be used to
manage SQL Server 2008. You can connect the Query Analyzer to a SQL
Server 2008 instance and run queries, but the Object Explorer and other
tools are not compatible with SQL Server 2008.
When a server is registered,
you have several options available for managing the server. You can
right-click the server in the Registered Servers window to start or stop
the related server, open a new Object Explorer window for the server,
connect to a new query window, or export the registered servers to an
XML file so that they can be imported on another machine.
Tip
The import/export
feature can be a real timesaver, especially in environments where many
SQL servers are managed. You can export all the servers and groups
registered on one machine and save the time of registering them all on
another machine. For example, you can right-click the Database Engine
node, select Export, and then choose a location to store the XML output
file. Then all you need to do to register all the servers and groups on
another machine is move the file to that machine and import the file.
Object Explorer
The
Object Explorer window that existed in the SQL Server 2000 Query
Analyzer was integrated into SSMS in SQL Server 2005. SQL Server 2008
continues to use an integrated Object Explorer that behaves like SQL
Server 2005.. The most significant feature for those folks managing a
large number of database objects is the capability to populate the
Object Explorer tree asynchronously. This may not hit home for folks who
deal with smaller databases, but it can be a real time saver for those
that are dealing with many databases on a single SQL Server instance or
for those that work with databases that have a significant number of
database objects. The Object Explorer tree in SSMS displays immediately
and allows navigation in the tree and elsewhere in SSMS while the
population of the tree is taking place.
The Object Explorer is
adaptive to the type of server it is connected to. For a Database Engine
server, the databases and objects such as tables, stored procedures,
and so on are displayed in the tree. If you connect to an Integration
Services server, the tree displays information about the packages
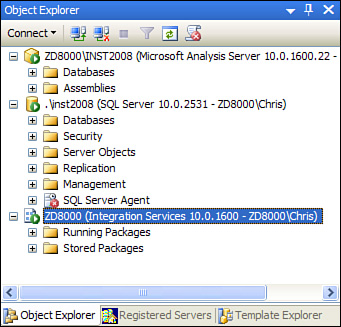
defined on that type of server. Figure 1
shows an example of the Object Explorer with several different types of
SQL Server servers displayed in the tree. Each server node has a unique
icon that precedes the server name, and the type of server is also
displayed in parentheses following the server name.
The objects displayed in the
Object Explorer tree can be filtered in SQL Server 2008. The number of
filters is limited, but those that are available can be helpful. For
example, you can filter the tables displayed in Object Explorer based on
the name of the table, the schema that it belongs to, or the date on
which it was created. Again, for those who deal with large databases and
thousands of database objects, this feature is very helpful.
Administrators also
find the enhanced scripting capabilities in the Object Explorer very
useful. The scripting enhancements are centered mostly on the
administrative dialog boxes. These dialogs now include a script button
that allows you to see what SSMS is doing behind the scenes to effect
your changes. In the past, the Profiler could be used to gather this
information, but it was more time-consuming and less integrated than
what is available now.
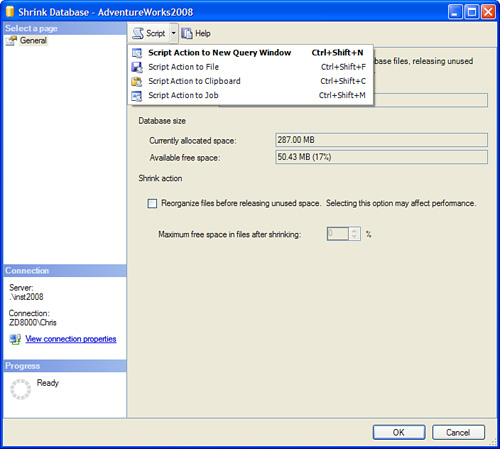
Figure 2
shows an example of an administrative dialog, with the scripting
options selected at the top. You can script the commands to a new query
window, a file, the Windows Clipboard, or a job that can be scheduled to
run at a later time.
Aside from these features, many
of the features and much of the functionality associated with the Object
Explorer is similar to what was found in SQL Server 2000 and is almost
identical to what was found in SQL Server 2005. Keep in mind that there
are some additional nodes in the Object Explorer tree and that some of
the objects are located in different places. For example, the Management node now contains nodes for Policy Management, Data Collection, and the Resource Governor, which are all new in SQL Server 2008.
One
often-overlooked Object Explorer feature is the reports option that was
added in SQL Server 2005 and still exists in SQL Server 2008. This
option is available by right-clicking on a node in the Object Explorer.
Reports are not available for every node in the Object Explorer tree,
but many of them do have this option. Most reports are found in the
top-level nodes in the tree. For example, if you right-click on a
database in the Object Explorer tree and then select Reports and
Standard Reports, you see more than a dozen available reports. These
reports include Disk Usage, Backup and Restore Events, Top Transactions
by Age, and a host of others. Graphs are included with some reports, and
you can export or print all these reports. Figure 3 shows an example of the Disk Usage report for the AdventureWorks2008 database.
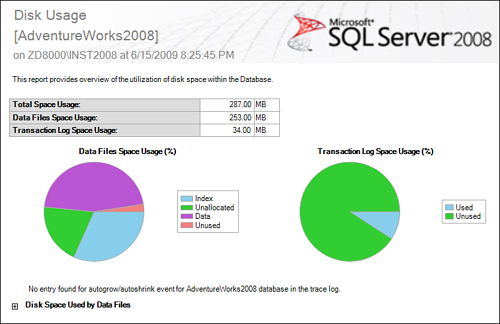
The graphs are easy to read,
and some sections of the report can be expanded to provide more detail.
Bullets at the bottom of a report are nodes that can be expanded. For
example, the bullet Disk Space Used by Data Files at the bottom of Figure 4.8 can be expanded to display details about each of the data files.
Activity Monitor
The Activity Monitor has seen
some dramatic changes in SQL Server 2008. These changes build on the
foundation established in SQL Server 2005 and help provide much more
information related to the performance of your SQL Server instance.
Before we get into the details of the Activity Monitor, let’s make sure you know where to find it. It is no longer found in the Management
node of the Object Explorer. Instead, you right-click on the name of
the server instance in the Object Explorer, and you see a selection for
Activity Monitor.
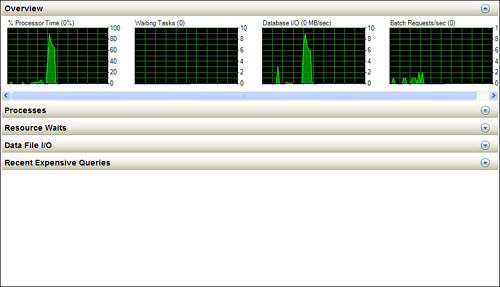
When the Activity Monitor launches, you see a new display with four different graphs, as shown in Figure 4.
The graphs include % Processor Time (from SQL Server), Waiting Tasks,
Database I/O and Batch Requests. These graphs give you a quick
performance snapshot for your SQL Server in one spot without having to
launch System Monitor or some other monitoring tool to view this kind of
information.
You also find more detailed
performance information below the graphs. This information is grouped
into four categories: Processes, Resource Waits, Data File I/O and
Recent Expensive Queries. Clicking on the expand button for one of these
categories presents the details you are looking for. These details
contain drop-down headings that allow you to filter the results and view
only the information you need.
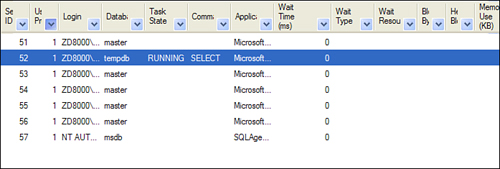
The Processes Details
window contains information similar to what was displayed in the SQL
Server 2005 Activity Monitor. These details include information similar
to what is returned with the sp_who
system stored procedure. The server process ID (SPID) is listed in a
column named Session ID, and the related information for each SPID is
displayed in the remaining columns. If you right-click on a particular
process, you can see the details of that process. You can then kill that
process or launch the SQL Server Profiler to trace the activity for the
process. Figure 5 shows an example of the expanded Processes details window.
The Resource Waits window
(that is displayed below the Process window) can help you identify
bottlenecks on your server. It details the processes waiting for other
resources on the server. The amount of time a process is waiting and the
wait category (what the process is waiting for) are found in this
display. If you click on the Cumulative Wait Time column, the rows are
sorted by this column and you can find the wait category that has been
waiting the longest. This sorting capability applies to all the columns
in the display.
The
Data File I/O window lists each database and its related database
files. The amount of disk I/O experienced by each of the files is
detailed in the columns of this display. You can isolate the database
and files that are most heavily hit with read or write activity as well
as the databases that may be suffering from poor I/O response with this
screen.
Finally, the Recent
Expensive Queries window displays information similar to what you can
obtain using catalog views. It provides statistics for all the databases
on the instance and is a quick and easy way to find and tune expensive
SQL statements. If you right-click on a row in the display and click
Edit Query Text, you can see the entire SQL text associated with the
query. You are able to click on one of the column headings such as CPU
to sort the display according to the metric you feel defines cost. Best
of all, you can right-click on a row and choose Show Execution Plan, and
you have the Query Plan ready for analysis.