SQLQueryStress
is a simple, lightweight performance testing tool, designed to load
test individual queries. It includes support for randomization of input
parameters in order to test cache repeatability, and includes basic
capabilities for reporting on consumed server resources.
This tool can be downloaded from the Apress web site (http://www.apress.com) or the book's companion web site (http://www.expertsqlserver2005.com).
In order to get comfortable with the tool, let's take a quick tour of its capabilities. Figure 1 shows the main screen.
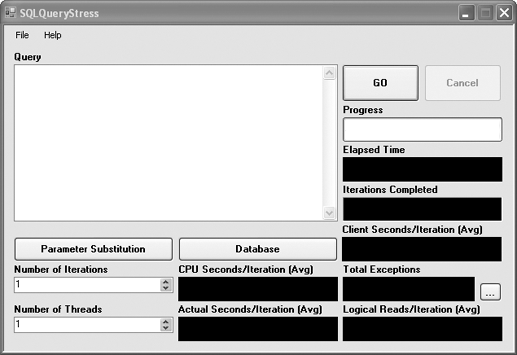
The main features here are as follows:
The Query area is where
you can enter the query that you'd like to load test. This can be either
a T-SQL query or a call to a stored procedure. You can also include
variable names, which can be used for dynamic parameter substitution.
The Number of
Iterations box is where you can define how many times the query should
be executed by each virtual user as defined in the Number of Threads
box. You can specify up to 200 threads, which will run the query
simultaneously in order to simulate load.
The GO button starts the
load test. During the test the Progress bar indicates the number of
tests completed as compared to the number of tests to be run. The
Iterations Completed box displays how many tests have actually been run,
and the Total Exceptions box displays the number of exceptions that
have occurred during the run. Clicking the ... button next to the Total
Exceptions box pops up a window where you can view the details of the
exceptions.
There are three types
of time statistics collected and displayed by the tool. The Client
Seconds/Iteration (Avg) box displays the average runtime over all
iterations, as recorded on the client. The CPU Seconds/Iteration (Avg)
and Actual Seconds/Iteration (Avg) boxes both display time statistics
reported by SQL Server. The former is the average reported CPU time, and
the latter is the average reported total query time. Another statistic
collected and shown by the tool is the number of logical reads (which is
an amalgamation of buffer cache and disk reads), in the Logical
Reads/Iteration (Avg) box.
During a run, the load test
can be stopped before it is complete using the Cancel button. Keep in
mind that a lot of tear-down needs to take place in order to cleanly
cancel a run. Especially if you're running a lot of simultaneous
threads, you may see cancellations take several seconds.
Before a load test can be
run, a database connection must be set up. This is done by clicking the
Database button, which launches a connection settings dialog box.
The final button on the main
screen is Parameter Substitution. This feature allows you to supply
SQLQueryStress with a set of input values that will be dynamically
applied to parameters of your query for each run, such that data caching
does not incorrectly skew the results of the test.
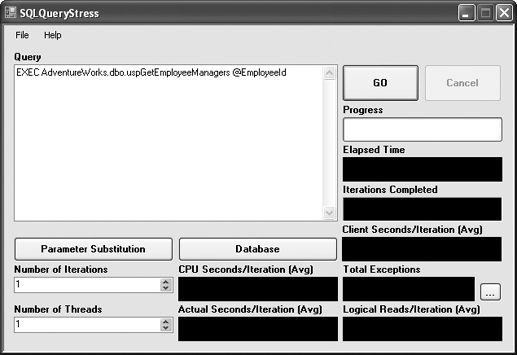
For an example of where this might be used, consider the uspGetEmployeeManagers stored procedure in the SQL Server 2005 AdventureWorks sample database. This stored procedure has a single parameter, @EmployeeID.
If this procedure were load tested in a loop and the same value were
used for the parameter for every call, every run after the first would
be faster thanks to data caching. This would defeat the accuracy of the
test, because we would not know how the procedure would behave if
uncached data was requested. To fix this problem, it's important to pass
in many different values during the course of the load test.
To set this up, the query
should be entered into the Query text box with a variable in the place
of any parameters that need to be substituted, as shown in Figure 2.
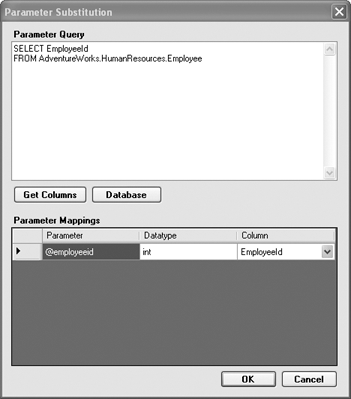
Once the query is entered in the text box, click the Parameter Substitution button, which brings up the screen shown in Figure 3.

The most important feature of
this screen is the Parameter Query text box. This is where you define
the query that pulls back the parameter values you'd like to dynamically
substitute for the main query. In this case, we might want to pass in
every employee ID in the AdventureWorks HumanResources.Employee table, so the following query might be used:
SELECT EmployeeId
FROM AdventureWorks.HumanResources.Employee
Once the parameter query is
entered, the Get Columns button is used to set up the Parameter
Mappings grid to allow the user to map the columns from the parameter
query to the parameters defined in the main query. Each column in the
parameter query can be mapped to one or more variables found in the main
query. The completed mapping screen for this query is shown in Figure 4.
After clicking OK, the load test can be run, and for each iteration a new value will be substituted in for the @EmployeeID
parameter. If the tool runs out of values, it will loop around and
reuse previous values in the set, until it has completed the requested
number of iterations.
From the File menu on the main screen, you can enter the Options dialog box, shown in Figure 5. These options allow you to control some of the parameters for the test, in order to simulate various settings.
Changing the Connection Timeout option makes the tool wait longer before reporting an exception if the target server does not respond.
Connection Pooling can be disabled to show the affect of creating and destroying a new connection on each test iteration.
Modification of the Command Timeout option will make the tool report an exception if the query does not complete in time.
Changing the Collect I/O Statistics and Collect Time Statistics
options will make the tool not collect the server time (CPU and Actual)
and Reads statistics. This will make the run somewhat lighter-weight
from a resource utilization point of view.
Finally, the Force Client Retrieval of Data
option forces the tool to loop over all data returned by the query,
thereby ensuring that it is sent over the network by SQL Server. By not
setting this option, there is a chance—especially with larger
queries—that the majority of the data may stay buffered in SQL Server,
thereby not creating a realistic amount of network stress.

As a final note, it's
important to mention that inside of the File menu is an option to save
the settings for a particular query, including database connection
information and parameter settings. It can take a bit of time to set up a
full SQLQueryStress test, and there is no reason to lose the work if
you need to rerun the same test more than once.
