One of the great tools available in the SQL
Server 2000 Query Analyzer, the built-in SQL Debugger, was left out of
SQL Server Management Studio (SSMS) in SQL Server 2005. Fortunately, SQL
Server 2008 brings the T-SQL debugger back to SSMS.
The Transact-SQL debugger in SQL Server Management
Studio enables you to step through Transact-SQL scripts, stored
procedures, triggers, and functions as they are running. The
Transact-SQL debugger allows you to do the following:
- Step through the Transact-SQL statements in the Query Editor line by line or set breakpoints to stop at specific lines.
- Step into or over Transact-SQL stored procedures, functions, or triggers run by the code in the query editor window.
- Watch the values assigned to variables and observe system objects such as the call stack and threads.
If you want to run the T-SQL Debugger, the query editor window must be connected to SQL Server as a member of the sysadmin server role.
Note
Debugging of T-SQL code should be done only on a test
or development server, not on a production server. Debugging sessions
can often run for long periods of time while you are investigating the
operations of your Transact-SQL statements. If the code being debugged
involves a multistatement transaction, locks acquired by the session
could be held for extended periods while the code is paused in the
debugger until the debugging session is ended or the transaction
committed or rolled back. This could lead to extensive locking
contention or blocking for other applications accessing production data.
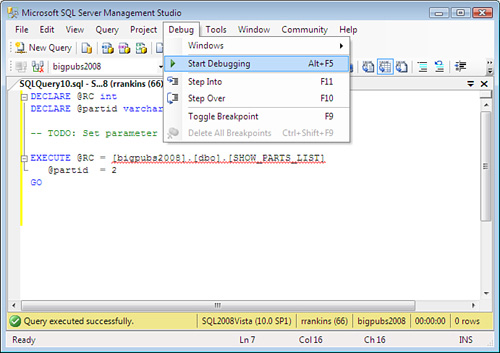
You start the debugger in a query editor window by
either clicking the Debug button on the Query toolbar or by clicking
Start Debugging on the Debug menu, as shown in Figure 1.
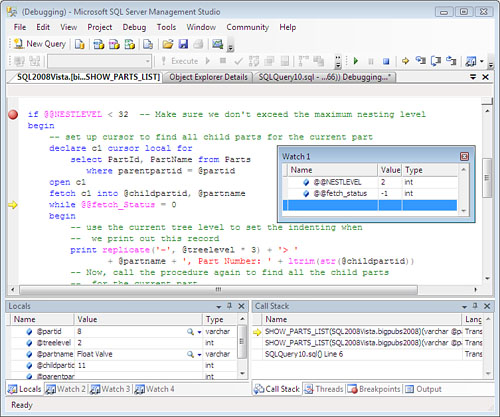
When the query editor window enters debug mode, the
debugger initially stops on the first line of code in the stored
procedure, as shown in Figure 2.
You can then set any breakpoints and run to the breakpoints or step
through the procedure code one line at a time. You can press F10 to step
through the code one line at a time. If the SQL code invokes a stored
procedure or function, or a DML statement invokes a trigger, you can
press F11 to step into the called routine. If you step into a routine in
the T-SQL Debugger, SQL Server Management Studio opens a new query
editor window populated with the source code for the routine, places the
window into debug mode, and then pauses execution on the first
statement in the routine. You can then step through or set breakpoints
in the code for that routine.
Located near the bottom of the debugger window are
some useful information windows. The first group of windows is the
Locals/Watch window, which displays the contents of local variables or
any watch expressions you have defined. The Locals window displays the
current values in all the local variables within the current scope. You
can also modify the values of the variables in the Locals window to test
various scenarios or to adjust data values so the code executes
differently. To modify the value of a variable, right-click the row and
select Edit Value.
In the four Watch windows, you can add variables or expressions whose values you want to watch, such as the global variables @@NESTLEVEL, @@FETCH_STATUS, or @@ROWCOUNT.
To add an expression to a Watch window, you can either select Add Watch
in the QuickWatch dialog box or enter the name of the expression in the
Name column of an empty row in a Watch window. The Watch windows, like
the other tabbed windows in the debugger, can be set as docked or
floating windows, allowing you to view multiple windows simultaneously (Figure 2 shows an example of the Watch1 window set as a floating window).
The second group of windows is the Call Stack,
Breakpoints, Output, and Results and Messages windows. The Call Stack
window displays the current execution location and also displays
information about how execution passed from the original query editor
window to the current execution location through any other functions,
procedures, or triggers. The Breakpoints window lets you view
information about the breakpoints you have set. From this window, you
can also jump to the source code where the breakpoint is set or disable
or delete the breakpoint. The Output window displays various messages
and program data, including system messages from the debugger. The
Results and Messages tabs on the query editor window display the results
of previously executed Transact-SQL statements within the debugging
session. The query editor window stays in debug mode until either the
last statement in the query editor window is executed or you manually
stop debugging. You can stop debugging, along with any further statement
execution, using any one of the following methods:
- On the Debug menu, click Stop Debugging.
- On the Debug toolbar, click the Stop Debugging button.
- On the Query menu, click Cancel Executing Query.
- On the Query toolbar, click the Cancel Executing Query button.
If you want to stop debugging but allow the
remaining Transact-SQL statements to run to completion, click Detach All
on the Debug menu.
