Logo
programming4us
programming4us
programming4us
programming4us
Home
programming4us
XP
programming4us
Windows Vista
programming4us
Windows 7
programming4us
Windows Azure
programming4us
Windows Server
programming4us
Windows Phone
 
Windows Server

SharePoint 2010 PerformancePoint Services : Examining Show Details Reports

- Free product key for windows 10
- Free Product Key for Microsoft office 365
- Malwarebytes Premium 3.7.1 Serial Keys (LifeTime) 2019
4/9/2011 4:40:17 PM
The show details feature is another report view that provides detailed row level information for a KPI or report. As with the decomp tree, the show details report is available from the context menu when browsing an analytical chart, grid, or scorecard. However, unlike the decomposition tree, which provides an interactive drill-down experience, the show details report provides a static display of data organized in a table format.

Note

Although this report is automatic in the analytic report types, some configuration is necessary to make this available on a scorecard. For example, the calculation for the KPI row needs to be set to Source Data. If the KPI row on the scorecard is configured in this way, right-clicking this data cell offers the Show Details option, which can be accessed by right—clicking the context menu.


Show details reports are most useful when you identify a value that seems interesting, but you would like more information on the exact data values that contribute to the data point of interest.

In The Green Orange example mentioned earlier that uses an analytic graph to compare viewers against potential viewers, you can see a dip in viewers for episode 107. You can right-click the data point for this episode to see the context menu for the show details report (see Figure 1).
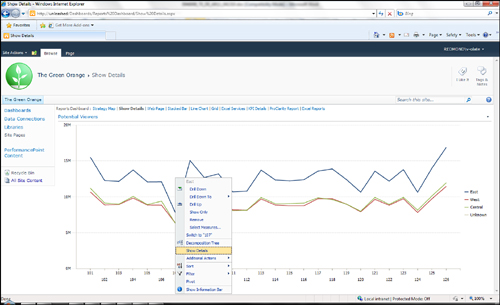
Figure 1. The Show Details option is also available from the context menu on analytical charts, grids, or scorecards.

When you select the Show Details option, the Details page appears in a separate browser window. The Details page shows all the database rows that contribute to the value calculated by Analysis Services (see Figure 2).
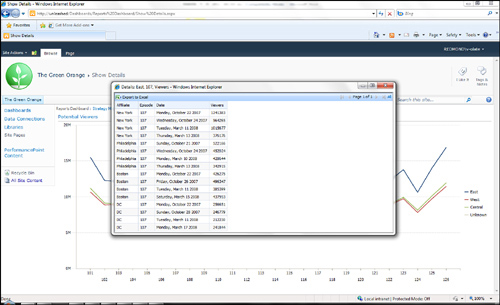
Figure 2. The Details page displays the databases rows that contribute to the value calculated by Analysis Services.

Tip

When the data is in the show details report, the data can be exported to Excel, where you can do a deeper analysis. Look for the Export to Excel icon in the upper-left corner of the report.


Under the covers, this report uses the SQL Server Analysis Services drill-through feature. This means that any limitations on the drill-through feature applies to the show details feature. For example, calculated members in the cube do not have a Show Details option.

Other -----------------
- SharePoint 2010 PerformancePoint Services : Examining Decomposition Tree Reports
- SharePoint 2010 PerformancePoint Services : Reports - Strategy Map
- Windows Server 2008 R2 : Installing DFS (part 2) - Creating a DFS Folder and Replication Group & Configuring DFS Read-Only Replication
- Windows Server 2008 R2 : Installing DFS (part 1) - Creating the DFS Namespace and Root & Adding an Additional Namespace Server to a Domain-Based Namespace
- Windows Server 2008 R2 : File System Management and Fault Tolerance - Planning a DFS Deployment
- Windows Server 2008 R2 : File System Management and Fault Tolerance - The Distributed File System
- Windows Server 2003 : Creating Role-Specific Server Configurations (part 2) - Securing Infrastructure Servers & Securing File and Print Servers
- Windows Server 2003 : Creating Role-Specific Server Configurations (part 1) - Securing Domain Controllers
- Exchange Server 2010 Management and Maintenance Practices : The Exchange Control Panel
- Exchange Server 2010 Management and Maintenance Practices : Maintenance Tools for Exchange Server 2010
 
 
Top 10
- Microsoft Visio 2013 : Adding Structure to Your Diagrams - Finding containers and lists in Visio (part 2) - Wireframes,Legends
- Microsoft Visio 2013 : Adding Structure to Your Diagrams - Finding containers and lists in Visio (part 1) - Swimlanes
- Microsoft Visio 2013 : Adding Structure to Your Diagrams - Formatting and sizing lists
- Microsoft Visio 2013 : Adding Structure to Your Diagrams - Adding shapes to lists
- Microsoft Visio 2013 : Adding Structure to Your Diagrams - Sizing containers
- Microsoft Access 2010 : Control Properties and Why to Use Them (part 3) - The Other Properties of a Control
- Microsoft Access 2010 : Control Properties and Why to Use Them (part 2) - The Data Properties of a Control
- Microsoft Access 2010 : Control Properties and Why to Use Them (part 1) - The Format Properties of a Control
- Microsoft Access 2010 : Form Properties and Why Should You Use Them - Working with the Properties Window
- Microsoft Visio 2013 : Using the Organization Chart Wizard with new data
 
programming4us
Windows Vista
programming4us
Windows 7
programming4us
Windows Azure
programming4us
Windows Server