A common requirement of clients is to allow end users
to filter data from scorecards and reports on a dashboard based on a
time intelligence formula. Time intelligence formulas allow users to
view data over time, such as year over year (YOY), last period, rolling
average, and year to date (YTD).
For example, to implement
this capacity in an Analysis Services cube, the cube implementer needs
to create that type of formula using a language native to Analysis
Services. In Analysis Services, the language used is Multidimensional
Expressions (MDX). To implement this capacity against a tabular data
source, you need to implement it using a language native to the data
source. For example, if your data source is a SQL database, you need to
use T-SQL.
PPS provides its own
expression language called Simple Time Period Specification (STPS). STPS
enables you to create time intelligence formulas rapidly. For example,
if you want to see aggregated data based on YTD, you can create a time
intelligence filter and use the following formula:
If you want to apply this data to 2009 sales
numbers and the current month is July, this STPS expression aggregates
all 2009 sales data from the first month of the current year to the
current month. Under the covers, this expression is translated to the
data source’s native language. In this next section, you see this
formula in action.
Tip
Time intelligence can be a
confusing topic. To gain a better understanding of how it works, use the
SQL Profiler to see how your STPS formulas are translated into MDX or
T-SQL depending on which data source you are working against.
Configuring Time
Intelligence for an Analysis Services Data Source
For STPS to work, you need
to configure the data source so that your expressions properly match the
time definition in the data source. Look at the previous code example:
For this expression to work,
you need to explain to STPS how year and month are defined in the data
source. In other words, you need to map how time is defined in the data
source to an internal, conformed master time dimension against which
STPS works.
In this first example,
you configure TheGreenOrange Analysis Services data connection that you
created earlier.
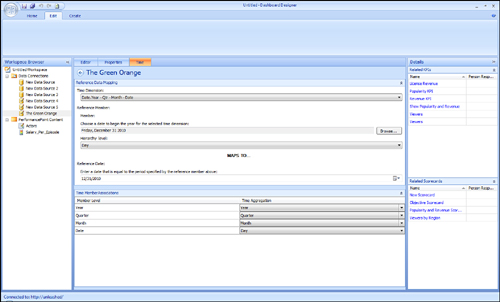
The following steps describe how
to configure the screen shown in Figure 1:
1. | Notice
that both the Analysis Services and tabular data sources have a Time
tab. To successfully use time intelligence features, select a dimension
named Date and a hierarchy named Year—Qtr—Month—Date to specify which
dimension and hierarchy in the cube defines time.
|
2. | Select a reference member and a hierarchy level because
all Time Intelligence operations are calculated with these settings as a
reference point. Any date within the cube should work fine because PPS
can extrapolate other dates after one of them is selected.
Caution
A best practice is to ensure
that the cube you are working with has its time dimension starting at
the beginning of the calendar year. There were some issues in PPS 2007
where calendars starting at random intervals returned the wrong data.
|
3. | Specify
how the hierarchy levels in the data source’s time dimension maps the
internal, conformed master time dimension. The available hierarchy
levels for the master time dimension are on the right side in the Time
Member Associations area, as shown in Figure 1.
|
The
Analysis Services data source is now configured to support STPS
expression.
Tip
Suppose you have a data source
that has multiple time dimensions and you want to use both time
dimensions. The solution is to create a new data source for each time
dimension you want to use in your PPS solution. For example, if the cube
you are using has both calendar year and fiscal year dimensions, you
can create two data sources using the same server and cube information
with the only difference being the time dimension selected in the Time
tab of each data source. When creating KPIs or filters, select the data
source with the time dimension that makes sense for that object.
Configuring a Tabular
Data Source
Configuring a time dimension for a
tabular data source is slightly different from working with an Analysis
Services data source. It is not necessary to select a reference member
because PPS builds its own calendar and automatically maps it to the
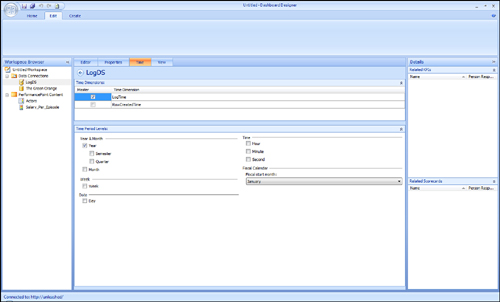
dimension. In this example, you configure a SQL Server table data source
for which all tabular data is configured the same.
You have two columns that are
treated as time dimensions in the data source: LogTime and
RowCreatedTime. Select the LogTime column for this example. Figure 2
shows the completed settings.
Note
Although it is
possible to select multiple columns as time dimensions for tabular data
sources, only the one with the check box selected is considered the
“master” time dimension. If a time dimension is not the master time
dimension, it is effectively just another dimension.
