Troubleshooting crawls on content sources can be a
frustrating and time-consuming task. This is why it is important to
understand the crawl and indexing process and the associated tools that
are used to reveal problems or errors at each stage of the crawl
process. The following sections will discuss the crawl logs, then the crawl reports, then finish by discussing Diagnostic Logging.
The Search Administration page uses the Crawl History Web Part to present a summary of crawl activities, as shown in Figure 1.
The hyperlinked content sources open the Edit Content Source page for
that content source, and the hyperlinked numbers in the Success or All
Errors columns open filtered views of the crawl log to display just
those items.

Note:
By default, the Web Part shows the last six crawls per page, but that number can be modified by editing the Web Part.
1. Using Crawl Logs
The crawl logs will be your
tool for determining modifications needed for crawl settings including
timeouts or crawler impact rules. They are also your primary
troubleshooting tools for determining the cause of problems such as why
the crawler is not accessing certain documents or certain sites. On the
positive side, you can use the logs to see if an individual document has
been crawled successfully, and if so—but the user is unable to find the
document via a query—you’ll be able to focus your troubleshooting
efforts on helping the user refine their query. The crawl logs can be
accessed from the Crawl Log link in the Crawling section of the Search
Administration page or from the context menu for the content source on
the Manage Content Sources page.
Note:
Crawl logs may be your first
indication of problems on your sites. If the crawler (which has Read
permissions for everything) cannot access items, then users cannot
access them either. Any URLs that exceed the protocol limitations may be
exposed first in crawl log errors.
Each hyperlinked number on a
crawl log page opens a filtered view of the log. So if you click a
number on the page, notice that the log will have already filtered the
view based on the status type, without regard to date or time. You can
then apply other filters available from drop-down boxes.
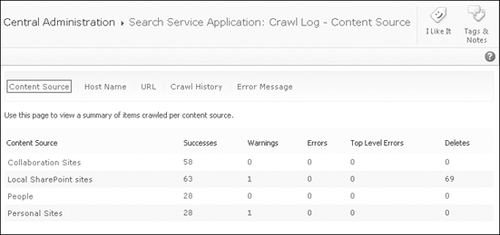
The crawl
logs have five different views that present different levels of
information, filtering options, and drilldown capabilities. The default
Content Source view, shown in Figure 2, presents summary counts of the five status types: Successes, Warnings, Errors, Top Level Errors, and Deletes.
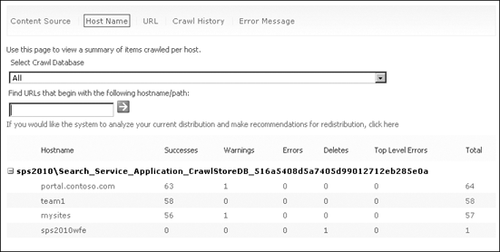
After the crawl log is opened, other views can be selected from the toolbar. The Host Name view in Figure 3
presents a summary of items crawled per host as well as the same status
type counts as the Content Source view, plus a total column. It
provides a search box for locating specific URLs that is useful when
crawling large numbers of URLs or finding errors for specific sites
within a URL.
Note:
If you would like the system to analyze your current distribution and make
recommendations for redistribution, click here
The URL view shown in Figure 4 presents more information about the error, such as the error message, the content source, and the last time crawled.
This list is normally extremely long, because it presents every action
on every item. The advanced search filtering tool is useful for troubleshooting crawls
and revealing user activities that create problems, such as uploading
files with file names so long that the files cannot be opened or
downloaded. It also reveals files that are too large for the default
crawl settings. In this case, only the first portion of the file is
indexed.
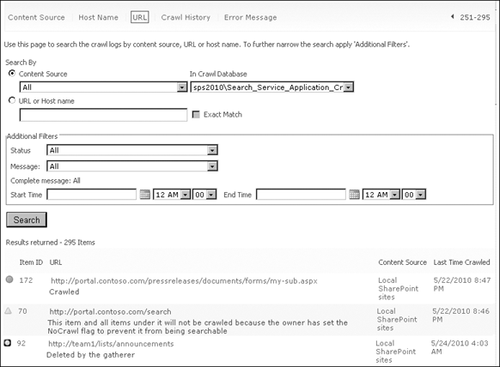
The status message of each
document appears below the URL, along with a symbol indicating whether
the crawl was successful. Also notice that in the right-hand column of
the table, the date and time of the message have been generated.
The status types are as follows.
Success The crawler successfully connected to the content source, read the content item, and passed the content to the indexer.
Warning The crawler connected to the content source and tried to crawl the content item, but could not for whatever reason.
Error The crawler could not communicate with the content source.
Top Level Errors
These are errors at the root of an application or site collection that
would impact all content below. Top level errors can result in shorter
logs, because identical errors for individual items in that container
are not recorded.
Deletes Deleted by the gatherer. In Figure 4, the deletion was made because an application was moved from one content source to another.
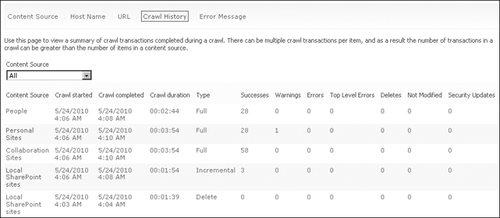
The Crawl History view shown in Figure 5 gives information about specific crawls
but does not provide any drilldown tools and only provides filtering on
Content Source. This information is useful in adjusting crawl schedules
and identifying the more dynamic content sources.
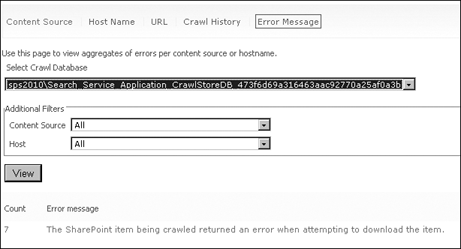
The Error Message view shown in Figure 6
aggregates all errors into a list of errors with a count of each.
Clicking the hyperlinked number opens the URL view filtered to that
particular error message. Other filters can then be applied to focus the
presentation.
