2. Using Crawl Reports
SharePoint 2010
provides search administration reports enabled by default to help you to
determine the health of your search service applications. All reports
have filters to target the results. In the Reports section of the Search
Administration page, the link to Administration Reports opens the
Administrative Report Library, which contains a Search administration
reports folder.
That folder contains basic
search administration reports that show high-level monitoring data
aggregated from all components for the selected search service
application. There are two basic search administration reports for
crawling.
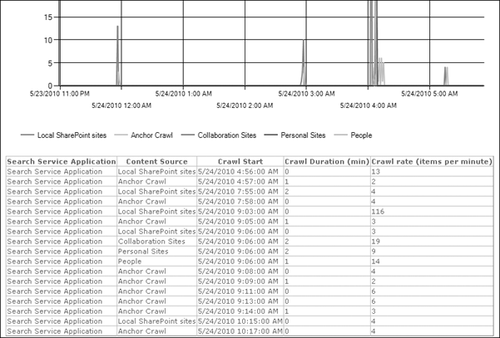
Crawl Rate Per Content Source, shown in Figure 7,
which provides a view of recent crawl activity sorted by content
source. The anchor crawl is the process in which anchor text from links
between items is added to a full-text index catalog. It appears as a
separate (virtual) content source.
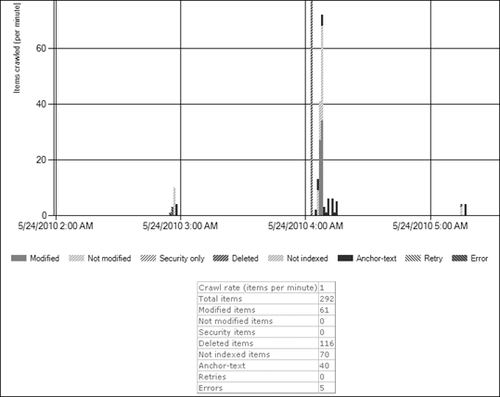
Crawl Rate Per Type shown in Figure 8
provides a view of recent crawl activity, sorted by items and actions
for a given URL. These items and actions include modified items, deleted
items, retries, errors, and others.


In the advanced reports
subfolder, there are three additional default reports. These reports
show more in-depth monitoring data aggregated from all components for
the selected search service application.
Crawl Processing Per Activity
This report provides a view of where crawl processing occurs in the
pipeline, per minute. The timings per component are grouped by activity,
such as filtering or word breaking.
Crawl Processing Per Component
This report provides a view of where crawl processing occurs in the
pipeline, per minute. The timings are grouped by component, such as File
Protocol Handler or Anchor Plug-in.
Crawl Queue
This report provides a view of the state of the crawl queue, displaying
incoming links to process and outgoing transactions queued.
These five reports will help
you determine when the search service topology needs modification. A
SharePoint 2010 Products Management Pack is available for Microsoft
System Center Operations Manager to provide more detailed performance
monitoring.
3. Diagnostic Logging
Reports are derived
from information first collected in logs, so for effective reporting you
must configure the collection of data. To do this, open a Web browser,
go to the Central Administration website, and open the Monitoring page.
Under the Reporting heading, open the Configure Diagnostic Logging page
and expand the Office Search Server. This page displays the current
logging levels and provides settings to control the severity of events
captured in the Windows event log and the trace logs. The number of
events logged and the logging overhead will increase as the severity of
the events decreases.
The following categories are available for SharePoint Server Search.
Admin Audit
Administration
Advanced Tracing
Anchor Plug-in
Anchor Text Plug-in
Anchor Text Plug-in Cache
Anchor Text Plug-in Links
Connector Framework
Content Index Server
Content Plugin
File Protocol Handler
Gatherer
Gatherer Service Catalog
HealthRule
HTTP Protocol Handler
Indexing
Matrix Protocol Handler
Notes Protocol Handler
Plug-in
Propagation Manager
Query
Query Processor
Remote Exchange Store Protocol Handler
Search service
Although you cannot configure
categories individually within the page, you can select a collection of
items to be configured alike at the same time and then click OK. You
will then need to reopen the page to configure another selection of
items differently.
For the event log, the reporting levels are
None
Critical
Error
Warning
Information
Verbose
For the trace logs, the event logging levels are
None
Unexpected
Monitorable
High
Medium
Verbose
Enabling Event Log Flood Protection suppresses logging of the same event repeatedly until the conditions return to normal.
On this page, you
determine the location for the trace logs, the number of days to store
them, and the amount of space reserved for them. Move them away from the
operating system files, where filling the drive space could crash the
system; it is preferable to have them on another spindle with no I/O
conflict.
Logging normally would be set at a level that would expose abnormal activity and would increase when troubleshooting.
Note:
The log file location is a
farm-wide setting. The drive and full path must exist on all servers in
the farm. This setting will not create the folder structure.