System Startup and Recovery
The
System Startup and Recovery utility stores system startup, system
failure, and debugging information. It also controls the behavior (what
to do) when a system failure occurs.
To open System Startup and
Recovery, launch Control Panel, select System and Security, select
System, Advanced System Settings, click the Advanced tab in the Systems
Settings dialog box, and then click Settings under Startup and Recovery
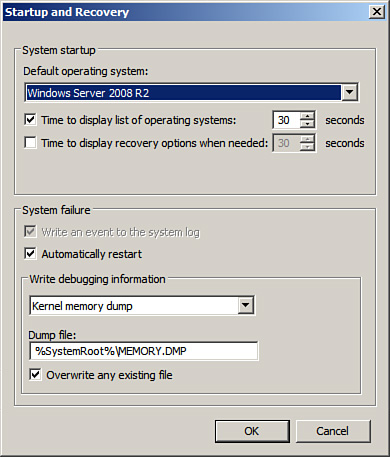
to display a property page similar to the one shown in Figure 2.

The Default Operating System
field contains information that is displayed at startup. This
information is typically the name of the operating system such as
Windows Server 2008 R2. You can edit this information using bcdedit from
a command prompt. If the machine is dual-booted, there will be an entry
for each operating system. The Time to Display List of Operating
Systems option specifies the time the system takes to display the name
of the operating system at startup. The default time is 30 seconds. This
can be increased or reduced. The Time to Display Recovery Options When
Needed is unchecked by default but can be selected and an interval in
seconds entered.
You can set the action to be
taken when system failure occurs in the System Failure section. There
are two options. The first option is Write an Event to the System Log.
This action is not editable in Windows Server 2008 R2 because this
action occurs by default every time a stop error occurs. The next
option, Automatically Restart, reboots the system in the event of a
system failure.
The
Write Debugging Information section tells the system where to write
debugging information when a system failure occurs. The options
available include where the debugging information can be written to and
the level of debugging information: Small Memory Dump (128KB), Kernel
Memory Dump, Complete Memory Dump, or (None). The Write Debugging
Information To option requires a paging file on the boot volume, which
should be large enough to contain the select debugging option.
Windows Memory Diagnostics Tool
Many troubleshooting
scenarios revolve around memory-related issues associated with a system.
Typical memory issues can involve an errant application, a specific
process consuming too much memory, or failing hardware such as bad RAM
or the memory system on the motherboard. Thankfully, Windows Server 2008
R2 includes a tool for diagnosing problems associated with system
memory.
By using Windows
Memory Diagnostics Tool, an administrator has another means for
isolating root issues when a server is performing poorly, subject to
crashes, or other abnormal behavior not caused by issues with the OS or
installed applications.
The Windows Memory Diagnostics Tool can be launched by following the instructions below:
1. | First, save all work and close down open applications and utilities.
|
2. | To invoke the tool, select Start, All Programs, Administrative Tools, Windows Memory Diagnostic, or type MdSched at a command prompt.
|
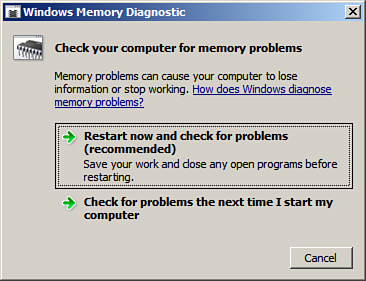
3. | Select
whether you want to Restart Now and Check for Problems or Check for
Problems the Next Time I Start My Computer, as displayed in Figure 3.

|
4. | When
the system is rebooted, the Diagnostics tool automatically launches and
conducts a Basic test by using default settings. Additional Test Mix
options, Cache options,
and Pass Count can be selected by pressing F1. The Test Mix options
consist of Basic, Standard, and Extended, whereas the Cache option
includes Default, On, or Off. In addition, set the Pass Count value. The
value represents the number of times the entire test mix will be
repeated. Note a value of 0 represents infinitely. Press F10 to apply
the settings and start the memory tests. Status is reported throughout
the test indicating results.
|
Tip
The Windows Memory
Diagnostics Tool might not detect all the problems with the system RAM.
Just because no errors are reported doesn’t mean the RAM or even the
motherboard is working properly. Typically, the manufacturer of the
hardware device will have additional diagnostics utilities that enable
an administrator to conduct a deeper analysis of the root problems at
the hardware level.
Resources and Support Tools
Software errors can be
reported in Windows Server 2008 R2. The Windows Error Reporting
mechanism makes this happen. Additionally, the Customer Experience
Improvement Program (CEIP) enables the system to report information to
Microsoft about computer hardware and usage.
The errors reported in the
error-reporting mechanism and information derived from the Customer
Experience Improvement Program can be sent automatically or when the
user is prompted to notify Microsoft to help improve its future
products.
You can manage the
Software Error-Reporting Mechanism by selecting the Enable Automatic
Updating link in the Update This Server section on the Initial
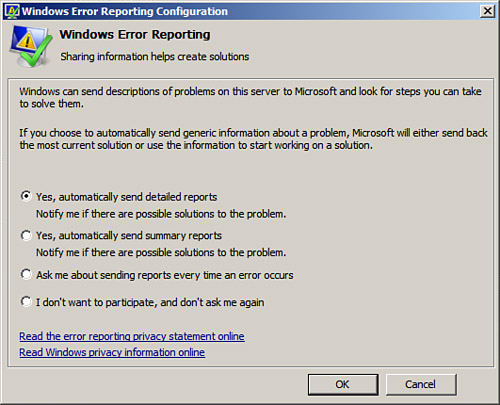
Configuration Tasks screen. To change Windows Error Reporting, select
the Manually Configure Settings link and click the Change Settings
button in the Windows Error Reporting section. Select the appropriate
participation option, as displayed in Figure 4.

The Customer
Experience Improvement Program Configuration screen can be launched by
clicking the Change Settings button in the Customer Experience
Improvement Program section. When the dialog box is invoked, select
whether you want to participate in the Windows Server Customer
Experience Improvement Program and indicate the number of servers,
desktops, and industry that best represents your organization.
Finally, the combination
of the resources and support tools help administrators better log,
troubleshoot, and solve issues with a Windows Server 2008 R2 system. At
the same time, Microsoft collects this information to improve the
product.