Scheduling Reports
The Operations
Manager 2007 R2 infrastructure collects many Windows Server 2008 R2 data
points. This information can be presented in reports, which can be
generated ad hoc or scheduled. The scheduling option is very useful, as
it reduces the need to actively open the console and instead the reports
are delivered via email.
Performance Reports
When managing a number of
agents, it can be difficult to pinpoint the problem systems. For
example, which systems are the most heavily utilized? A report showing a
graph of all the resources would be very messy and difficult to read
even in a medium-sized organization with a number of servers. Operations
Manager 2007 R2 has a set of reports that address this specific
concern, the Performance Top Objects and Performance Top Instances.
These reports take data from performance collection rules, perform some
statistical analysis, and list the top systems.
For example, Figure 1
shows the top five systems with the most processor utilization. It is
based on the “Processor % Processor Time Total 2008” rule. It shows the
top five heaviest processor utilization systems for the previous week.
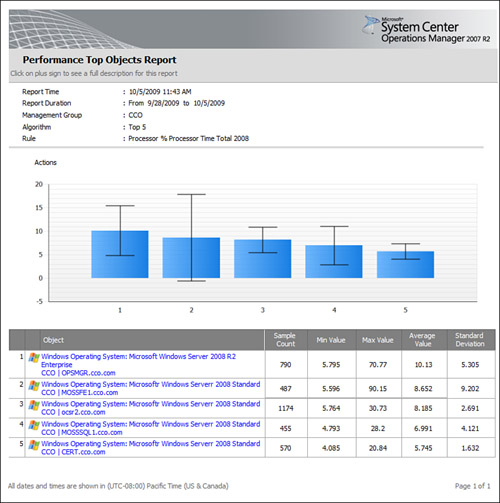
This report is one of the
reports in the Microsoft Generic Report Library and can be used against
any performance counter. The report can pick the top (the default) or
bottom objects, as well as vary the number of objects to return (the
default is five).
The best-practice recommendation is to generate daily reports spanning the previous week for the following rules:
Processor % Processor Time Total 2008
Page File Percentage Use 2008
Memory % Committed Bytes in Use 2008
Network Adapter Bytes Total per Second 2008
% Logical Disk Free Space 2008
The Performance Top Objects
report for each of these rules gives a good overview of the performance
issues (or lack thereof) over the collection of all the monitored
systems. These should be delivered on a daily basis in an email or to a
share.
To schedule a report for email delivery, use the following steps:
1. | Launch the Operations Manager 2007 R2 console.
|
2. | Select the Reporting space.
|
3. | Select the Microsoft Generic Report Library node.
|
4. | Right-click the Performance Top Objects report and select Open.
|
5. | In the From field, select Advanced.
|
6. | Change
the Offset to minus and the number of days to 7. Click the green check
mark (OK) to save the selections. The From field will show “Today -7
day(s)”.
|
7. | Change both the From and the To times to 12:00 AM.
|
8. | In the Rule field, click the Browse button.
|
9. | In the Rule Name field, enter Processor % Processor Time Total 2008 and click the Search button.
|
10. | In the Available Items pane, select the rule and click OK.
|
11. | Click Run and confirm that the report looks good.
|
12. | Select File, Schedule.
|
13. | In the Description, enter Processor % Processor Time Total 2008 Report.
|
14. | In the Delivery Method field, select Email.
|
15. | In the To field, enter the SMTP address of the recipient.
|
16. | In the Subject field, replace @ReportName with Processor % Processor Time Total 2008 Report. The variable name is unfortunately very long and ugly, so it’s best to replace it.
|
17. | Click Next.
|
18. | Change the schedule to Daily.
|
19. | Change the time to be the time that the report should be generated on a daily basis, for example 6:00 a.m. Click Next.
|
20. | Because
the report was generated and all the parameters were selected
initially, no parameters need to be changed. This method ensures that
the email report will match expectations.
|
21. | Click Finish to save the scheduled report.
|
The report will now be
automatically generated every morning at 6:00 a.m. and delivered via
email to the recipients. Additional reports can be created in exactly
the same way for the recommended rules and any others that are needed.
To review the schedules, go to the Scheduled Reports node in the
Reporting space. The schedules can be adjusted as well.
Note
The
performance rules are generally specific to each operating system.
Thus, the reports are specific to each operating system. The rules in
this section reflect Windows Server 2008 and Windows Server 2008 R2
performance data. If there are other operating systems such as Windows
Server 2003, additional reports using those rules would need to be
created.
OpsMgr 2007 R2 Maintenance Reports
There are also reports on
Operations Manager 2007 R2 that should be generated to ensure that the
health and performance of the infrastructure is good. The reports to
generate are as follows:
Most Common Alerts—
This report is useful for determining what alerts are the noisiest and
might be spamming the Inboxes of notification subscribers. The report
shows which alerts are most common and gives additional statistical
analysis.
Alert Logging Latency—
This report is useful for determining the health of the OpsMgr
infrastructure, as measured by the time an event occurs on a managed
computer to the time an alert is raised. If this is too long (that is,
greater than 30 seconds), it indicates that there is a problem.
SQL Database Space report—
This report shows the database space and growth of SQL databases. This
is generated against the OpsMgr databases to monitor the growth.
These reports should be
generated on a weekly basis (for example, Monday at 6:00 a.m.) spanning
the previous week and be sent to the Operations Manager administrators.
The Most Common Alerts report
is based on the management packs that are installed. By default, the
report selects all the installed management packs and shows the top five
most common alerts. To schedule the Most Common Alerts report, execute
the following steps:
1. | Launch the Operations Manager 2007 R2 console.
|
2. | Select the Reporting space.
|
3. | Select the Microsoft Generic Report Library node.
|
4. | Right-click the Most Common Alerts report and select Open.
|
5. | In the From field, select Advanced.
|
6. | Change
the Offset to minus and the number of days to 7. Click the green check
mark (OK) to save the selections. The From field will show “Today -7
day(s)”.
|
7. | Change both the From and the To times to 12:00 AM.
|
8. | Click Run and confirm that the report looks good.
|
9. | Select File, Schedule.
|
10. | In the Description, enter Most Common Alerts Report.
|
11. | In the Delivery Method field, select Email.
|
12. | In the To field, enter the SMTP address of the recipient.
|
13. | In the Subject field, replace @ReportName with Most Common Alerts Report.
|
14. | Click Next.
|
15. | Change the schedule to Weekly and ensure that only Mon is checked.
|
16. | Change the time to be the time that the report should be generated on a daily basis, for example 6:00 a.m. Click Next.
|
17. | Because
the report was generated and all the parameters were selected
initially, no parameters need to be changed. This method ensures that
the email report will match expectations.
|
18. | Click Finish to save the scheduled report.
|
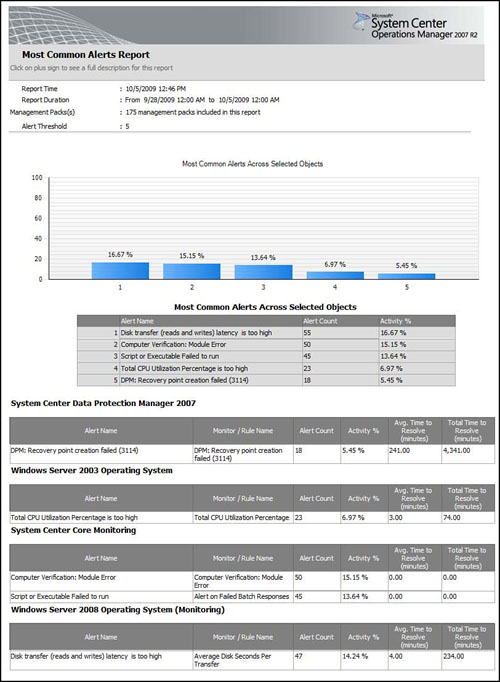
Figure 2
shows an example of the Most Common Alerts report. The most common
alert for the previous week was the Disk Transfer Latency Is Too High,
with 16.67% of alerts. This alert could be tuned to reduce the volume of
alerts or the problem resolved.
The Alert Logging
Latency report is based on the objects selected. The report does not
include any objects by default, so the objects must be selected. It is a
best practice to select the groups of agents, agentless, and agent
watchers objects. To schedule the Alert Logging Latency report, execute
the following steps:
1. | Launch the Operations Manager 2007 R2 console.
|
2. | Select the Reporting space.
|
3. | Select the Microsoft Generic Report Library node.
|
4. | Right-click the Alert Logging Latency report and select Open.
|
5. | In the From field, select Advanced.
|
6. | Change
the Offset to minus and the number of days to 7. Click the green check
mark (OK) to save the selections. The From field will show “Today -7
day(s)”.
|
7. | Change both the From and the To times to 12:00 AM.
|
8. | Click the Add Group button.
|
9. | In the Group Name field, enter agent and click the Search button.
|
10. | Select
the Agent Managed Computer Group, the Agentless Managed Computer Group,
and the Microsoft.SystemCenter.AgentWatchersGroup and click the Add
button.
|
11. | Click OK to save the selections.
|
12. | Click Run and confirm that the report looks good.
|
13. | Select File, Schedule.
|
14. | In the Description, enter Alert Logging Latency Report.
|
15. | In the Delivery Method field, select Email.
|
16. | In the To field, enter the SMTP address of the recipient.
|
17. | In the Subject field, replace @ReportName with Alert Logging Latency Report.
|
18. | Click Next.
|
19. | Change the schedule to Weekly and ensure that only Mon is checked.
|
20. | Change the time to be the time that the report should be generated on a daily basis, for example 6:00 a.m. Click Next.
|
21. | Because
the report was generated and all the parameters were selected
initially, no parameters need to be changed. This method ensures that
the email report will match expectations.
|
22. | Click Finish to save the scheduled report.
|
The Alert Logging
Latency report will now generate on a weekly basis and be emailed to the
recipients. The report has two pages with lots of statistical analysis
of the alert latency. It is one of the more complicated reports in the
OpsMgr library of reports.
Finally, the SQL Database
Space report is based on the databases. This report does not have any
objects selected by default, so the Operations Manager database objects
will need to be selected. To schedule the SQL Database Space report, run
the following steps:
1. | Launch the Operations Manager 2007 R2 console.
|
2. | Select the Reporting space.
|
3. | Select the SQL Server 2008 (Monitoring) node.
|
4. | Right-click the SQL Database Space report and select Open.
|
5. | In the From field, select Advanced.
|
6. | Change
the Offset to minus and the number of days to 7. Click the green check
mark (OK) to save the selections. The From field will show “Today -7
day(s)”.
|
7. | Change both the From and the To times to 12:00 AM.
|
8. | Click the Add Object button.
Note
When the Add Object
window appears, note that there is a caution triangle with the text
“Filter Options Have Been Applied.” The objects returned will only be
those that match the report criteria, in the case of SQL database
objects. This is new to Operations Manager 2007 R2. Before this, all
object classes would be returned and it was difficult to ensure that the
correct objects were included in the report. Many times, reports would
be returned without any data at all due to the incorrect objects being
selected. This is a huge improvement in OpsMgr 2007 R2.
|
9. | In the Object Name field, enter Operations and click the Search button.
|
10. | Select all the OperationsManager databases and click the Add button.
|
11. | Click OK to save the selections.
|
12. | Click Run and confirm that the report looks good.
|
13. | Select File, Schedule.
|
14. | In the Description, enter Operations Manager Database Space Report.
|
15. | In the Delivery Method field, select Email.
|
16. | In the To field, enter the SMTP address of the recipient.
|
17. | In the Subject field, replace @ReportName with Operations Manager Database Space Report.
|
18. | Click Next.
|
19. | Change the schedule to Weekly and ensure that only Mon is checked.
|
20. | Change the time to be the time that the report should be generated on a daily basis, for example 6:00 a.m. Click Next.
|
21. | Because
the report was generated and all the parameters were selected
initially, no parameters need to be changed. This method ensures that
the email report will match expectations.
|
22. | Click Finish to save the scheduled report.
|
The SQL Database Space report will be delivered every week on Monday at 6:00 a.m.
These three reports help ensure that the Operations Manager 2007 R2 infrastructure is healthy and performing well.
