4. Using Performance Monitor
Performance Monitor in Windows Vista has been
enhanced to provide better visualizations, easier navigation, and more
granular control than was available in previous versions. When you
select the Performance Monitor node in the Reliability and Performance
Monitor, the System Monitor ActiveX control sysmon.ocx is loaded into
the host MMC process. System Monitor depends on the Performance Data
Helper library pdh.dll to interact with the various counter sources such
as real-time performance counters; stored binary files; and other,
older, counter log formats. The control also provides a scriptable
interface to display the performance counters.
The Performance Logs and Alerts (PLA) service is
an on-demand service that starts when needed for logging performance
data. This service is now implemented in pla.dll and runs in a shared
host process (svchost.exe) with the short name PLA. The PLA service
configuration information is located in the following registry key:
HKEY_LOCAL_MACHINE\SYSTEM\CurrentControlSet\Services\PLA
Since PLA now runs in a svchost process,
exceptions that occur in the other services that share the svchost
process can also affect the PLA service.
The following sections discuss the new features of Performance Monitor.
Important
When remotely monitoring
earlier systems using Reliability And Performance Monitor on a Windows
Vista computer, only the features that Performance Monitor supports on
the earlier version of Windows will be supported for the monitoring
session. |
New Features in Performance Monitor
New features in Performance Monitor include
time-based algorithms, scale to fit, drag and drop, new time range
controls, tool tips, and zoom functionality. The following sections
describe these new Windows Vista Performance Monitor features.
New Classes for Individual Data Sources
Performance Monitor has been divided into three modules, all implemented within ActiveX control sysmon.ocx classes:
Frame class Handles interactions such as COM-based interfacing and property dialog boxes
Data Source class Handles input/output of data source (log file, real-time data)
View class Interfaces with the charting class for visualization
This feature was implemented to modularize the
Performance Monitor code and to make it more extensible and scalable,
but it does not introduce any additional functionality.
Time-Based Algorithms
Time-based sample collection allows you to
collect performance-counter data based on a given time range.
Previously, if a logging session failed to collect data for some period
of time, the assumption was that all of the data was continuously
collected and showed no missing data points. This resulted in the
display of inaccurate data. The new time-based algorithms display gaps
in graphs when a log file has missing samples. This feature does not
introduce any new chart type.
Scale to Fit
Previously, because the values of some
performance counters might have exceeded the current graph scale, not
all of the data was visible and changing the graph or counter scales
required several steps. The scale-to-fit feature allows the scaling of
performance data to the current graph view on a counter-by-counter basis
without changing the overall graph scale or performing numerous steps
to change a particular counter’s scale. The scale-to-fit feature is
applicable to line and bar types of charts for both real-time and logged
data sources.
When a user selects counters and applies the
scale-to-fit feature to them, Performance Monitor automatically scales
the selected counters to the current graph view based on the range of
values for the counters. The view is updated to draw the graph with the
new scale factor so that the values fall within the graph’s current
vertical minimum and maximum ranges. The scale-to-fit feature does not
change the graph’s vertical minimum or maximum ranges. You can determine
the current scale factor for each counter from the Scale column in the
counter list pane.
To use the scale-to-fit feature, select the
counters you want to modify, right-click the counters at the bottom of
Performance Monitor, and select Scale Selected Counters. When you use
the scale-to-fit feature, you can select multiple counters by using
Ctrl+left-click to individually select multiple counters or by using
Shift+left-click to highlight a contiguous range of counters.
Performance Monitor uses an algorithm to determine the best scale factor
for each selected counter based upon its current range of values and
the graph scale. It then recalculates the data sample values and
displays them in the graph using the new scale factor.
Note
Because the vertical
minimum and maximum ranges are configurable and scaling uses a factor of
10, it is possible that the selected counter data still cannot be
displayed within the configured vertical graph range, depending upon the
selected counter’s values. |
Drag and Drop
This feature allows a user to drag any
Performance Monitor–related file into the display area to open the file.
The Performance Monitor display will change to reflect the actions
relevant to the opened file type. Supported file types include:
You can also drag multiple binary log files
(*.blg) into the Performance Monitor window. However, you cannot drag
multiple html, xml, csv, or tsv files; attempting to do so will generate
an error.
Time Range Control
Each performance counter data sample has a
timestamp that identifies when the data was collected. In previous
versions of Performance Monitor, users needed to view and change the
properties of a loaded log file to adjust the log’s visible timeframe
(on the x-axis). With Windows Vista, when the graph is a line chart,
time labels are now automatically displayed along the horizontal time
axis in the main Performance Monitor view.
The timestamp for the first and last sample
are always displayed. Because of limited x-axis space, time labels
cannot be displayed for all data points. The displayable time labels are
determined based upon the sample interval time and the currently
visible time range. The actual number of time labels displayed varies as
the size of the System Monitor graph window is resized or if the chart
area scale is changed.
Tool Tips
Tool tips are now displayed when you hover the
mouse over a data element in the Performance Monitor graph. The tool
tips will show performance-counter data for the element nearest to the
mouse pointer. This will be either the previous data point or the next
data-point, whichever is closest to the mouse pointer. Tools tips appear
only for visible chart data elements.
Zoom
The new zoom feature in Performance Monitor
provides you with the ability to easily view logged data in more detail
(you cannot zoom into real-time performance data). Users can select a
time range that they want to view in more detail and then use the new
Zoom To shortcut menu item to clear the current log view and replace it
with the zoomed time range. Fewer samples are displayed in the zoomed
time range but you can obtain more detail from the samples that are
displayed.
You can use the following methods to select a range of time to zoom in on:
Using the left mouse button, click the
graph to select the first time point, drag the mouse to the second time
point, and then release the mouse button. The selected time range will
be shadowed in the graph view. Click the right mouse button to open the
shortcut menu and select Zoom To.
Use the
time range slider control (visible under the graph) to select the
desired time range. You can use each end of the slider control to change
the time window you want to display. The selected time range will be
shadowed in the graph view. Click the right mouse button to access the
shortcut menu and then select Zoom To.
To zoom out, reset the time range using the
slider control and then select Zoom To again to zoom to the currently
selected time range. You can also use the left and right arrows on the
slider control to scroll the time range in the graph.
New Legend Control
The new Performance Monitor Legend Control
provides two features that allow easier, more granular control of the
displayed performance counters:
Previously, performance counter operations,
such as changing the scale factor, could only be performed on a single
counter, and the only way to hide a performance counter was to delete it
from the System Monitor view.
Now you can simultaneously select multiple
counters for manipulation. The possible operations on multiple selected
counters are Show Selected Counters, Hide Selected Counters, or Scale
Selected Counters. You can select multiple counters in the legend,
report, or chart window using standard keyboard or mouse functions
(CTRL+left-click or Shift+left-click). The selected counter items will
be highlighted for ease of identification.
You can also temporarily hide performance
counters from a graph or report view using the menu options. This
provides a convenient method for quickly hiding a counter to make a
graph more readable. To hide or show counters, users can either select
or clear the Show check box next to the desired counters, or they can
select the counter (or counters) and use the shortcut menu to show or
hide the selected counters. Note that the Show and Hide options do not
apply to the report view. Previously, the only way to remove a
performance counter from the current view was to delete it from the
System Monitor legend.
Add Counters Dialog
The Performance Monitor Add Counters dialog
has been redesigned based on user feedback to improve usability. The
design of the previous Add Counters dialog made it difficult for users
to confirm the performance counters that were being added. The new
interface, shown in Figure 2, has a hierarchical design that allows you to instantly see the counters that are being added to a log.
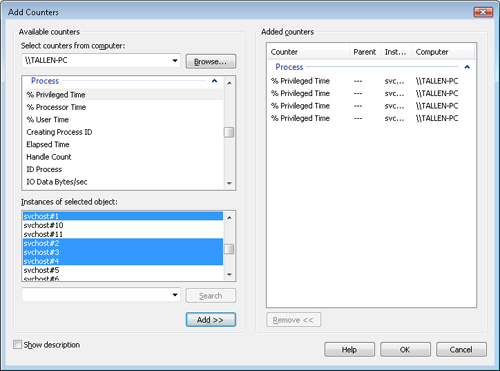
The Add Counters window contains a list of
available objects on the left side just below the computer name field.
You can view and select the counters for the selected object by clicking
the down arrow to the right of the object name. The instances
associated with the selected object are displayed in the Instances Of
Selected Object list. You can add any combination of objects, counters,
and instances by clicking the Add button with the desired elements
highlighted. The added elements are immediately displayed in the Added
Counters list. The Objects, Counters, and Instances windows support
multi-select so that you can select multiple items by using standard
keyboard or mouse functions (Ctrl+left-click or Shift+left-click) and
then adding to the log with one click of the Add button.
A search function is also available when the
All Instances option is present for a performance object. The search
feature provides you with the ability to search the available instances
for the selected object. The search results will be grouped into the
<All searched instances> instance item; you can add them to the log by clicking Add with the <All searched instances> item selected.
Transportable Configuration Files
In Windows 2000, Windows XP, and Windows
Server 2003, the configuration of each performance log or alert can be
saved to an HTML file, edited to change the computer name, and used as a
template to create a log for another computer. In Windows Vista, the
default configuration file format is changed to XML.
End of File Command
Performance Monitor previously used CreateProcess
to execute an End of File command to launch the specified process when a
log ended. To improve security and allow for flexibility of the
execution context (credentials), this feature is replaced by the ability
to start an existing Task Scheduler job when a log file completes.
Compare Feature
Performance Monitor now includes a Compare
feature that you can use to overlay multiple log files for relative
comparison. An adjustable level of transparency is added to the logs
being compared so that you can see through the logs that have been
overlaid. This feature is useful if, for example, a user wants to
compare server-resource utilization between 8:00 AM and 9:00 AM over a
weeklong period.
Using Performance Monitor
Overall performance-monitoring concepts have
changed very little since Windows NT 4.0. Windows Vista Performance
Monitor is now part of the Reliability and Performance Monitor, but
gathering performance data is in many ways unchanged from previous
versions. Real-time performance monitoring and performance monitor log
generation have changed slightly for Windows Vista, with most of the
changes occurring in the user interface.
Real-Time Performance Monitoring
As they did with previous versions of
Performance Monitor, users may perform real-time monitoring of the
performance characteristics of their systems in a one-second data sample
interval. The real-time monitoring interface, which you access by
clicking the Performance Monitor node under Monitoring Tools in the
Reliability and Performance Monitor interface, is often referred to as
System Monitor because it uses the ActiveX control sysmon.ocx. You can
add and view real-time performance counters for the local computer or
for a remote computer. Performance Monitor’s real-time monitoring
feature uses the new features discussed previously but otherwise has not
changed. You can add performance counters to a real-time line chart
view using one of two methods:
- Click the Add Counter icon (+) on the toolbar.
- Right-click the chart anywhere and then select Add Counters from the shortcut menu.
You can open a saved Performance Monitor file
for viewing by dragging the file into the Performance Monitor window or,
as in previous versions, by clicking the View Log Data cylinder on the
toolbar or pressing Ctrl+L. Another enhancement is the addition of the
Save Image As shortcut menu item that allows you to save the current
view as a GIF image file for later reference.
Performance Monitor Logging
In Windows XP, you created Performance Monitor
logs or alerts by using the Report Type node under Performance Logs And
Alerts in the Performance interface. You could configure each log to
contain a single data collection entity (counter log, trace log, or
alert). Performance Monitor in Windows Vista now uses the concept of
Data Collector Sets. In Windows Vista, a data collection entity is
referred to as a data collector and
must now be a member of a Data Collector Set (DCS). A DCS can contain
any number of data collectors, allowing for greater control over
performance monitoring and data organization tasks.
Note
Log
files created from Data Collector Sets in Windows Vista are not
backward-compatible with earlier versions of Windows. However, you can
view logs created in earlier versions of Windows in Performance Monitor
in Windows Vista. |
Data Collector Sets have been implemented to
provide support for performance reports that require data from multiple
log files of different types. These data collectors include counter,
trace, alerts, and system configuration logs. You can add an arbitrary
number of data collectors to a single DCS. Before Windows Vista, each
data collection entity contained its own scheduling properties to be
used by the Performance Logs and Alerts service. In Windows Vista, all
members of a DCS use the scheduling properties—and other common
properties—that have been specified for the parent DCS. The DCS is
implemented as a single Task Scheduler object, and you can specify a
single task to execute after all of the included data collectors have
completed.
There are three types of Data Collector Sets:
User-defined Most, if not all, user-configured Data Collector Sets fall into this category.
System
XML Data Collector Set templates that have been saved to
Windows\PLA\System are displayed here. You cannot create these; they are
included with Windows Vista.
Event trace sessions These are Data Collector Sets configured for Event Tracing for Windows (ETW) tracing.
The DCS concept provides the following features:
A DCS is the unit of scheduling for all of the data collectors in the DCS.
Log
file properties are divided between the DCS and individual data
collectors. Log file folder and subfolder properties are maintained by
the DCS so that they are consistent across all data collectors in the
set. File name properties and other file options are maintained for
individual data collectors.
The DCS
manages keyword and description metadata. You can locate the individual
data collectors by using the Windows Vista Search engine to search by
keyword.
Security is implemented at the DCS level. A single Run As account is used for all data collectors in the set.
A
new type of data collector is introduced, called a System Configuration
Data collector. The System Configuration Data collector gathers
specified data from the registry.
Each DCS has a description field. The DCS description will be a recognized Performance Logs and Alerts attribute.
