The first place to start with debugging is to examine ASP.NET page tracing. The Page class has a property named Trace. When Trace
is turned on, it tells the ASP.NET runtime to insert a rendering of the
entire context of the request and response at the end of the HTML sent
to the client.
You have already seen page
tracing to some extent. When you examined the ASP.NET server-side
control architecture, the page trace was invaluable in understanding the
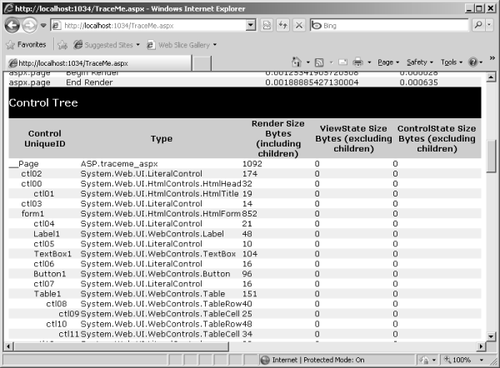
structure of the page. Remember, a rendered page is composed of a
number of server-side controls collected in a hierarchical tree. A Page
nests several controls, and the controls themselves might nest other
controls (they can be nested several levels deep, as a matter of fact).
The page trace includes a section displaying the composition of the page
in terms of server-side controls.
1. Tracing
Turning on tracing is easy. Simply set the Trace property of the page to true. You can turn on tracing either by modifying the ASPX code directly or by setting the Trace property using the Properties window in the Visual Studio Designer. Here's the Trace property being turned on directly in the ASPX code as part of the page directive:
<%@ Page Language="C#" AutoEventWireup="true" CodeFile="TraceMe.aspx.cs"
Inherits="TraceMe" Trace="true" %>
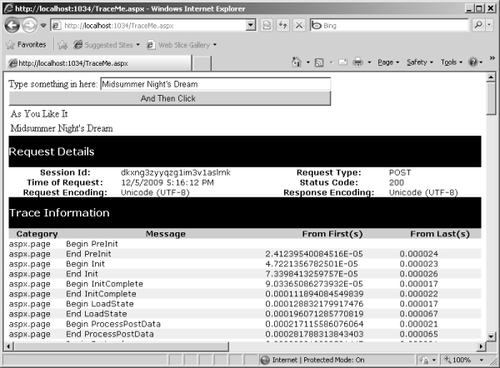
As soon as you turn on tracing and surf to the page, you'll see tracing information appear at the end of the HTML stream. The TraceMe.aspx page builds a table of strings
as they're entered on the site. The list of strings is kept in session
state and refreshes the table every time a new string is submitted.
Example 1. Code that builds a table on loading
public partial class TraceMe : System.Web.UI.Page
{
   ArrayList alTableEntries = null;

    protected void Page_Load(object sender, EventArgs e)
    {
      alTableEntries = (ArrayList)this.Session["TableEntries"];
      if (alTableEntries == null)
      {
         alTableEntries = new ArrayList();
      }
      AssembleTable();
    }

   protected void AssembleTable()
   {
      this.Table1.Rows.Clear();
      foreach (string s in alTableEntries)
      {
         TableRow row = new TableRow();
         TableCell cell = new TableCell();
         cell.Text = s;
         row.Cells.Add(cell);
         this.Table1.Rows.Add(row);
      }
   }

   protected void Button1_Click(object sender, EventArgs e)
   {
      alTableEntries.Add(this.TextBox1.Text);
      this.Session["TableEntries"] = alTableEntries;
      AssembleTable();
   }
}
|
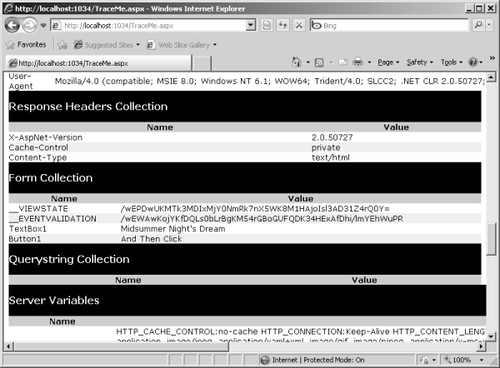
Figure 1 shows how the page appears with tracing turned on.
A bit farther down the tracing output, you can see the control tree. The control tree for this page is shown in Figure 2.
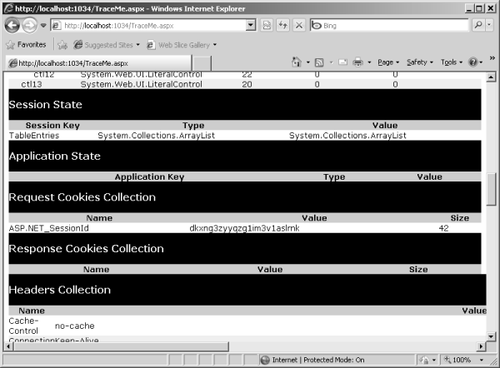
Finally, scroll down a bit more and you start seeing some of the context information associated with the request. Figures Figure 3 and Figure 4 show some of this context
information. This application uses session state to save the array of
strings. Notice that the session state tracing shows the contents of the
session state dictionary. You also get to see other context
information. For example, the tracing section shows the session ID and
the URL used to surf to this page.
Of course, much of this
information becomes more useful when there's a problem with your Web
site. For example, the table might stop building itself because you
somehow removed the session state item holding the list of strings. You
could detect that by examining the page trace.
If users begin to complain about layout issues with your site, you can
look at the user agent coming down with the request and learn that the
client is using a browser that your application does not accommodate.
2. Trace Statements
In addition to all the request context
information included with the HTML stream, the page trace also includes
specific statements printed out during execution. If you scroll to the
Trace Information block on the page, you can see these trace statements, as shown in Figure 5.
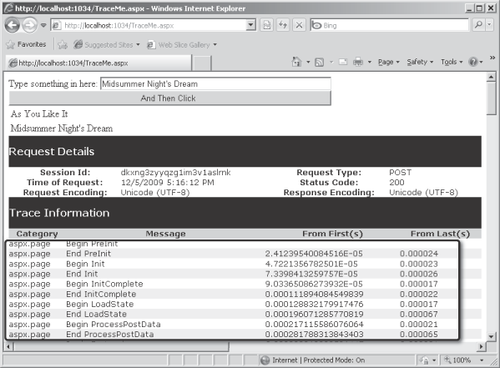
The ASP.NET framework produces the statements that appear in Figure 17-5. You can see the execution of the page progressing through the various events such as PreInit, Init, LoadState, and so forth.
Not only do you get tracing information from ASP.NET itself, but you can also insert your own tracing information. The Page class's Trace object provides a means of tracing page execution. Here's an exercise that shows you how to do this.
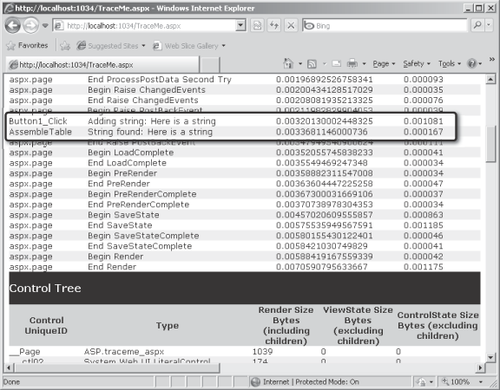
Adding tracing statements
Create a new Web site called DebugORama (it can be a File System–based Web site). Add a new page called TraceMe.aspx.
Open the TraceMe.aspx page and add the Label (which says "Type something in here:"), the TextBox, the Button, and the Table as they appear in the previous figures. Double- click the Button to add a handler for the Click event. Add the code from Example 1 (the code that builds the table during the Page's Load event). Enable tracing by including Trace="true" in the Page directive. Run the page to ensure that page tracing occurs.
Add tracing statements in strategic places through the page's Trace object. For example, you might want to monitor the table as it's being built. Do this by calling either Trace.Write or Trace.Warn in the page. Trace.Write renders the string in black, whereas Trace.Warn
renders the tracing string in red. The first parameter is a category
string you can use to help distinguish the statements you write when
they finally render. You can add whatever you want to the category
string.
public partial class TraceMe : System.Web.UI.Page
{
   ArrayList alTableEntries = null;

   protected void Page_Load(object sender, EventArgs e)
   {
      alTableEntries = (ArrayList)this.Session["TableEntries"];
      if (alTableEntries == null)
      {
         Trace.Warn("Page_Load", "alTableEntries is null");
         alTableEntries = new ArrayList();
      }
      AssembleTable();
   }

   protected void AssembleTable()
   {
      this.Table1.Rows.Clear();

      foreach (String s in alTableEntries)
      {
         Trace.Write("AssembleTable", "String found: " + s);
         TableRow row = new TableRow();
         TableCell cell = new TableCell();
         cell.Text = s;
         row.Cells.Add(cell);
         this.Table1.Rows.Add(row);
      }
   }

   protected void Button1_Click(object sender, EventArgs e)
   {
      Trace.Write("Button1_Click", "Adding string: " + this.TextBox1.Text);
      alTableEntries.Add(this.TextBox1.Text);
      this.Session["TableEntries"] = alTableEntries;
      AssembleTable();
   }
}
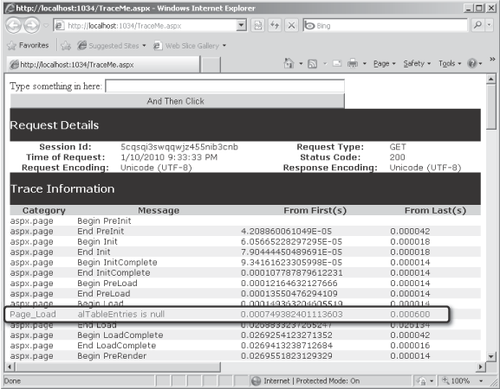
Compile the program and run the Web site. You should see your trace statements appearing in the output (as long as tracing is turned on). The tracing
will appear red on your computer screen—although it appears as gray in
the following graphics. The first graphic shows the string indicating alTableEntries is null.
The second graphic shows the tracing statement indicating when a string is added to the table.