You can edit chart data in a worksheet one cell at a
time, or you can manipulate a range of data. If you’re not sure what
data to change to get the results you want, use the Edit Data Source
dialog box to help you. In previous versions, you were limited to 32,000
data points in a data series for 2-D charts. Now you can have as much
as your memory to store (New!).
You can work with data ranges by series, either Legend or Horizontal.
The Legend series is the data range displayed on the axis with the
legend, while the Horizontal series is the data range displayed on the
other axis. Use the Collapse Dialog button to temporarily minimize the
dialog to select the data range you want. After you select your data,
click the Expand Dialog button to return back to the dialog box.
Edit Data in the Worksheet
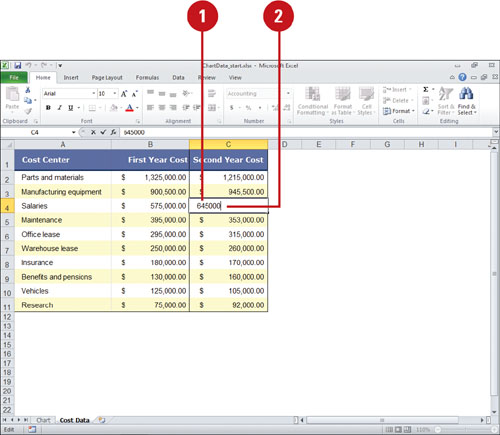
 In the worksheet, use any of the following methods to edit cell contents:
- To replace the cell contents, click the cell, type the data you want to enter in the cell. It replaces the previous entry.
- To edit the cell content, double-click the selected cell where you want to edit.
Press Delete or Backspace to delete one character at a time, and then type the new data.
 Press Enter to move the insertion point down one row or press Tab to move the insertion point right to the next cell.
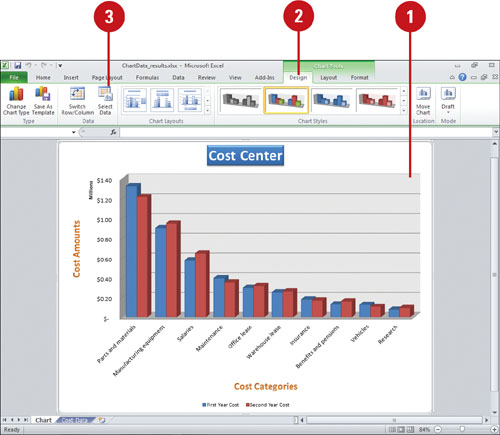
You can plot data series from rows or columns.
Select the chart, click the Design tab under Chart Tools, and then
click the Switch Row/Column button. This switches between plotting the
data series in a chart from worksheet rows or from columns.
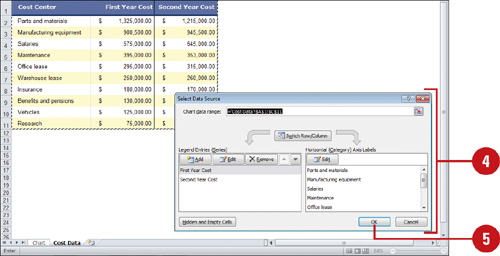
Edit the Data Source
- Click the chart you want to modify.
- Click the Design tab.
 Click the Select Data button on the Design tab under Chart Tools.
 In the Select Data Source dialog box, use any of the following:
Important
Click the Collapse Dialog button to minimize the dialog, so you can select a range in the worksheet. Click the Expand Dialog button to maximize it again.
- Chart data range. Displays the data range in the worksheet of the plotted chart.
- Switch Row/Column. Click to switch plotting the data series in the chart from rows or columns.
- Add. Click to add a new Legend data series to the chart.
- Edit. Click to make changes to a Legend or Horizontal series.
- Remove. Click to remove the selected Legend data series.
- Move Up and Move Down. Click to move a Legend data series up or down in the list.
- Hidden and Empty Cells. Click to plot hidden worksheet data in the chart and determine what to do with empty cells.
 Click OK.
Hidden data in rows and columns of
a worksheet is not displayed in a chart and empty cells are displayed
as gaps. In the Select Data Source dialog box, you can click the Hidden
and Empty Cells button to change the way Excel displays hidden data and
empty cells in a chart. You can set options to show data in hidden rows
and columns and show empty cells as a zero or connect data points with a
line.
