5. Developer Toolbar
A new
addition to SharePoint 2010 is the Developer Toolbar. The easiest way to
understand what the Developer Toolbar does is to see it in action. At
the time of writing, the only way to activate the Developer Dashboard is
via PowerShell or the STSADM tool. Since STSADM is being phased out as a
mechanism for managing SharePoint, we’ll use the PowerShell method:
From the Start menu, choose SharePoint 2010 Management Shell from the Microsoft SharePoint 2010 Products menu.
Type the following PowerShell commands at the prompt:
      $dash = [Microsoft.SharePoint.Administration.→
      SPWebService]::ContentService.DeveloperDashboardSettings;
      $dash.DisplayLevel = 'OnDemand';
      $dash.TraceEnabled = $true;
      $dash.Update()
Using this script, we’re setting the Developer Dashboard to OnDemand mode; other possible options are On and Off.
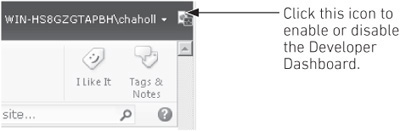
Now
if we navigate to the demo site that we created earlier, we can see
that a new icon has appeared in the upper-right corner, as shown next.
Clicking this icon enables or disables the Developer Dashboard.
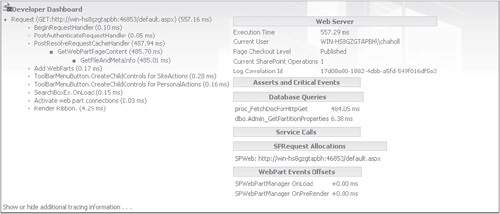
With the Developer Dashboard enabled, you can see
that every page now has additional information appended to the bottom,
as shown. You can use this information to track errors that have
occurred during page processing as well as resource usage and other
important metrics.
Another
important feature of the Developer Dashboard is that it allows
developers to write custom tracing information to it. Although I
mentioned that DebugView is an important tool for debugging complex
applications, when it comes to debugging and diagnosing problems at the
user-interface level, the Developer Dashboard provides much more
information and is therefore a better solution. Where DebugView proves
useful is in debugging issues that don’t occur in the user interface—for
example, issues in workflows or asynchronous event handlers .
Monitoring information from code that is wrapped
within a SPMonitoredScope object, as shown, is written to the ULS logs
as well as being visible from the Developer Dashboard. As a result,
using SPMonitoredScope is a good way to generate tracing information
that can be used by administrators to troubleshoot problems on a
production system.
using (new SPMonitoredScope("My monitored scope"))
  {
    //Code to be monitored
  }
6. Sandboxed Solutions
One of
the most common causes of system instability in SharePoint farms is
custom code. To provide administrators with more control
over the custom code that runs on a farm, SharePoint 2010 introduces the
concept of a sandboxed solution. As
the name suggests, a sandboxed solution is a custom code solution that
runs in an isolated sandbox. From an administrative perspective, a
number of configurable options are available for sandboxed solutions,
such as specifying resource quotas and monitoring performance.
Sandboxed solutions run in a separate process,
whereas other types of solutions run directly within the appropriate
SharePoint process. In addition to running in a separate process,
sandboxed solutions can utilize only a subset of the SharePoint Object
Model. A custom code access security (CAS) policy is applied to prevent
sandboxed code from performing actions that could jeopardize system
stability.
When you’re creating a
new SharePoint project using Visual Studio, you’ll see an option to
select a sandboxed solution or a farm solution. Bearing in mind that
sandboxed solutions have access only to a subset of the SharePoint API,
when you deploy as a sandboxed solution option, Visual Studio
IntelliSense displays assistance only for objects and members that are
available. Having said that, there is a catch: although IntelliSense
doesn’t provide assistance for inaccessible members, it is still
possible to write code using them. Such code will compile and deploy
fine but will throw an error at runtime.
Debugging Sandboxed Solutions
As mentioned, sandboxed solutions run under a
separate process. To debug such solutions, you need to connect to the
SPUCWorkerProcess.exe process manually using the Debug | Attach to
Process option in Visual Studio.
Managing Sandboxed Solutions
Sandboxed solutions are managed from the Solutions
Gallery, which is maintained at the site collection level. To access the
Solutions Gallery from any site, take the following steps:
From the Site Actions menu, select Site Settings.
On the Site Settings page, if it’s available, select Go To Top Level Site Settings.
Click the Solutions link in the Galleries section.
