Scalability is an issue for both single-tenant and
multi-tenant architectures. Although it may be acceptable to allow
certain operations at certain times to utilize most of the available
resources in a single-tenant application (for example, calculating
aggregate statistics over a large dataset at 2:00 A.M.), this is not an
option for most multi-tenant applications where different tenants have
different usage patterns.
You can use worker roles
in Windows Azure to offload resource-hungry operations from the web
roles that handle user interaction. These worker roles can perform tasks
asynchronously when the web roles do not require the output from the
worker role operations to be immediately available.
1. Example Scenarios for Worker Roles
The following table describes some example scenarios where you can use worker roles
for asynchronous job processing. Not all of these scenarios come from
the Surveys application; but, for each scenario, the table specifies how
to trigger the job and how many worker role instances it could use.
| Scenario | Description | Solution |
|---|
| Update survey statistics | The
survey owner wants to view the summary statistics of a survey, such as
the total number of responses and average scores for a question.
Calculating these statistics is a resource intensive task. | Every
time a user submits a survey response, the application puts a message
in a queue named statistics-queue with a pointer to the survey response
data.
Every 10 minutes, a
worker retrieves the pending messages from the statistics-queue queue
and adjusts the survey statistics to reflect those survey responses.
Only one worker instance should do the calculation over a queue to avoid
any concurrency issues when it updates the statistics table.
Triggered by: time
Execution model: single worker |
| Dump survey data to SQL Azure database | The
survey owner wants to analyze the survey data using a relational
database. Transferring large volumes of data is a time consuming
operation. | The
survey owner requests the back end to export the responses for a survey.
This action creates a row in a table named exports and puts a message
in a queue named export-queue pointing to that row. Any worker can
de-queue messages from export-queue and execute the export. After it
finishes, it updates the row in the exports table with the status of the export procedure.
Triggered by: message in queue
Execution model: multiple workers |
| Store a survey response | Every
time a respondent completes a survey, the response data must be
reliably persisted to storage. The user should not have to wait while
the application persists the survey data. | Every
time a user submits a survey response, the application writes the raw
survey data to BLOB storage and puts a message in a queue named
responses-queue.
A worker role polls the
responses-queue queue and when a new message arrives, it stores the
survey response data in table storage and puts a message in the
statistics-queue queue to calculate statistics.
Triggered by: message in queue
Execution model: multiple workers |
| Heartbeat | Many
workers running in a grid-like system have to send a “ping” at a fixed
time interval to indicate to a controller that they are still active.
The heartbeat message must be sent reliably without interrupting the
worker’s main task. | Every minute, each worker executes a piece of code that sends a “ping.”
Triggered by: time
Execution model: multiple workers |
Note:
You
can scale the Update Survey Statistics scenario described in the
preceding table by using one queue and one worker role instance for
every tenant or even every survey. What is important is that only one
worker role instance should process and update data that is mutually
exclusive within the dataset.
Looking at these example scenarios suggests that you can categorize worker roles that perform background processing according to the scheme in the following table.
| Trigger | Execution | Types of tasks |
|---|
| Time | Single worker | An
operation on a set of data that updates frequently and requires an
exclusive lock to avoid concurrency issues. Examples include
aggregation, summarization, and denormalization. |
| Time | Multiple workers | An operation on a set of data that is mutually exclusive from other sets so that there are no concurrency issues.
Independent operations that don’t work over data such as a “ping.” |
| Message in a queue | Single or multiple workers | An operation on a small number of resources (for example, a BLOB or several table rows) that should start as soon as possible. |
1.1. Triggers for Background Tasks
The trigger for a
background task could be a timer or a signal in the form of a message in
a queue. Time-based background tasks are appropriate when the task must
process a large quantity of data that trickles in little by little.
This approach is cheaper and will offer higher throughput than an
approach that processes each piece of data as it becomes available. This
is because you can batch the operations and reduce the number of
storage transactions required to process the data.
If the frequency at which new
items of data becomes available is lower and there is a requirement to
process the new data as soon as possible, using a message in a queue as a
trigger is appropriate.
You can implement a time-based trigger by using a Timer
object in a worker role that executes a task at fixed time interval.
You can implement a message-based trigger in a worker role by creating
an infinite loop that polls a message queue for new messages. You can
retrieve either a single message or multiple messages from the queue and
execute a task to process the message or messages.
| You can pull multiple messages from a queue in a single transaction. |
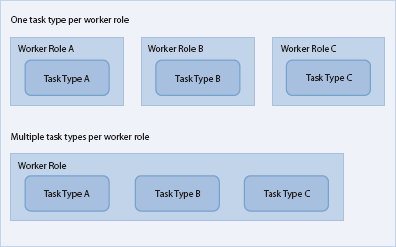
1.2. Execution Model
In Windows Azure, you process background tasks by using worker roles.
You could have a separate worker role type for each type of background
task in your application, but this approach means that you will need at
least one separate worker role instance for each type of task. Often,
you can make better use of the available compute resources by having one
worker role handle multiple types of tasks, especially when you have
high volumes of data because this approach reduces the risk of
under-utilizing your compute nodes. This approach, often referred to as
role conflation, involves two trade-offs. The first trade-off balances
the complexity of and cost of implementing role conflation against the
potential cost savings that result from reducing the number of running
worker role instances. The second trade-off is between the time required
to implement and test a solution that uses role conflation and other
business priorities, such as time-to-market. In this scenario, you can
still scale out the application by starting up additional instances of
the worker role. The diagrams in Figure 1 show these two scenarios.
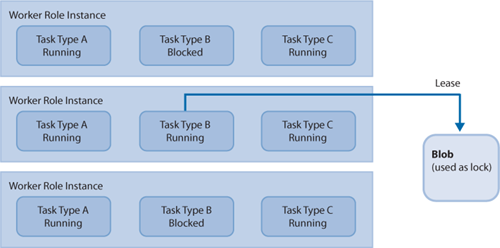
In the scenario where you
have multiple instances of a worker role that can all execute the same
set of task types, you need to distinguish between the task types where
it is safe to execute the task in multiple worker roles simultaneously,
and the task types where it is only safe to execute the task in a single
worker role at a time.
To ensure that only one copy
of a task can run at a time, you must implement a locking mechanism. In
Windows Azure, you could use a message on a queue or a lease on a BLOB
for this purpose. The diagram in Figure 2
shows that multiple copies of Tasks A and C can run simultaneously, but
only one copy of Task B can run at any one time. One copy of Task B
acquires a lease on a BLOB and runs; other copies of Task B will not run
until they can acquire the lease on the BLOB.
1.3. The MapReduce Algorithm
For some Windows Azure applications,
being limited to a single task instance for certain large calculations
may have a significant impact on performance. In these circumstances,
the MapReduce algorithm may provide a way to parallelize the calculations across multiple task instances in multiple worker roles.
The original concepts behind MapReduce come from the map and reduce
functions that are widely used in functional programming languages such
as Haskell, F#, and Erlang. In the current context, MapReduce is a
programming model
(patented by Google), that enables you to parallelize operations on a
large dataset. In the case of the Surveys application, you could use
this approach to calculate the summary statistics by using multiple,
parallel tasks instead of a single task. The benefit would be to speed
up the calculation of the summary statistics, but at the cost of having
multiple worker role instances.
| For the Surveys
application, speed is not a critical factor for the calculation of the
summary statistics. Tailspin is willing to tolerate a delay while this
summary data is calculated, so it does not use MapReduce. |
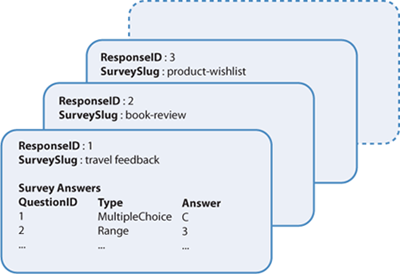
The following example
shows how Tailspin could use this approach if it wants to speed up the
calculation of the summary statistics.
This example assumes that the application saves survey responses in BLOBs that contain the data shown in Figure 3.
The following table shows the
initial set of data from which the application must calculate the
summary statistics. In practice, MapReduce
is used to process very large datasets; this example uses a very small
dataset to show how MapReduce works. This example also only shows the
summarization steps for the first multiple-choice question and the first
range question found in the survey answers, but you could easily extend
the process to handle all the questions in each survey.
| ResponseID | SurveySlug | Answer to first multiple choice question in survey | Answer to first range question in survey | Answers to other questions |
|---|
| 1 | travel-feedback | C | 3 | … |
| 2 | book-review | D | 3 | … |
| 3 | product-wishlist | A | 4 | … |
| 4 | service-satisfaction | E | 3 | … |
| 5 | travel-feedback | D | 5 | … |
| 6 | travel-feedback | C | 4 | … |
| 7 | purchase-experience | C | 2 | … |
| 8 | brand-rating | B | 3 | … |
| 9 | book-review | A | 3 | … |
| 10 | travel-feedback | E | 4 | … |
| 11 | book-review | D | 3 | … |
The first stage of MapReduce
is to map the data into a format that can be progressively reduced
until you obtain the required results. Both the map and reduce phases
can be parallelized, which is why MapReduce can improve the performance
for calculations over large datasets.
For this example, both
the map and reduce phases will divide their input into blocks of three.
The map phase in this example uses four parallel tasks, each one
processes three survey result BLOBs, to build the map shown in the
following table.
| AggregationID | SurveySlug | Number of responses | Histogram of first multiple choice question | Average of first range question |
|---|
| 1.1 | travel-feedback | 1 | C | 3 |
| 1.2 | book-review | 1 | D | 3 |
| 1.3 | product-wishlist | 1 | A | 4 |
| | | | | |
| 2.1 | service-satisfaction | 1 | E | 3 |
| 2.2 | travel-feedback | 2 | CD | 4.5 |
| | | | | |
| 3.1 | purchase-experience | 1 | C | 2 |
| 3.2 | brand-rating | 1 | B | 3 |
| 3.2 | book-review | 1 | A | 3 |
| | | | | |
| 4.1 | travel-feedback | 1 | E | 4 |
| 4.2 | book-review | 1 | D | 3 |
The next phase reduces this
data further. In this example, there will be two parallel tasks, one
that processes aggregations 1.X, 2.X, and 3.X, and one that processes
aggregation 4.X. It’s important to realize that each reduce phase only
needs to reference the data from the previous phase and not the original
data. The following table shows the results of this reduce phase.
| AggregationID | SurveySlug | Number of responses | Histogram of first multiple choice question | Average of first range question |
|---|
| 1.1 | travel-feedback | 3 | CCD | 4 |
| 1.2 | book-review | 2 | AD | 3 |
| 1.3 | product-wishlist | 1 | AD | 4 |
| 1.4 | service-satisfaction | 1 | E | 3 |
| 1.5 | purchase-experience | 1 | C | 2 |
| 1.6 | brand-rating | 1 | B | 3 |
| | | | | |
| 2.1 | travel-feedback | 1 | E | 4 |
| 2.2 | book-review | 1 | D | 3 |
In the next phase, there
is only one task because there are only two input blocks. The following
table shows the results from this reduction phase.
| AggregationID | SurveySlug | Number of responses | Histogram of first multiple choice question | Average of first range question |
|---|
| 1.1 | travel-feedback | 4 | CCDE | 4 |
| 1.2 | book-review | 3 | ADD | 3 |
| 1.3 | product-wishlist | 1 | AD | 4 |
| 1.4 | service-satisfaction | 1 | E | 3 |
| 1.5 | purchase-experience | 1 | C | 2 |
| 1.6 | brand-rating | 1 | B | 3 |
At this point, it’s not
possible to reduce the data any further, and the summary statistics for
all the survey data that the application read during the original map
phase have been calculated.
It’s now possible to update
the summary data based on survey responses received after the initial
map phase ran. You process all new survey data using MapReduce and then combine the results from the new data with the old in the final step.
