1. Generating Mailbox Statistics Reports
Although it is possible to write scripts that use Windows Management
Instrumentation or Messaging Application Programming Interface (MAPI) to
generate mailbox statistics reports, and such scripts can still be found on the
Internet, Exchange Server 2010 (and Exchange Server 2007) provides a less
complex method of achieving the same results. EMS cmdlets provide direct access
to the statistics you require, and PowerShell cmdlets offer you the facility to
generate formatted reports from the command line or to export information in
text or CSV files that can be read and manipulated by other software packages,
such as Microsoft Office Excel.
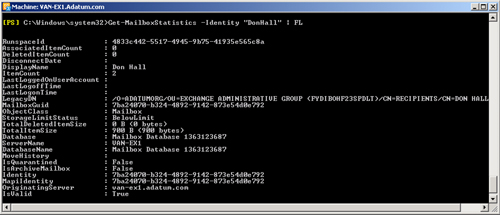
If you run the Get-MailboxStatistics EMS cmdlet against a
Mailbox server or against a mailbox database or an individual mailbox on the
Mailbox server on which the command is entered, it lists the display name of the
mailbox, the number of items in the mailbox, the mailbox storage limit status,
and the last logon time. If you want to find out what other statistics are
available for a mailbox, you can pipe the output into the PowerShell
FL cmdlet. Doing this for every
mailbox on a server would typically provide too much information, so you would
typically specify a mailbox. For example, the following command lists all the
statistics for the Don Hall mailbox:
Get-MailboxStatistics -Identity "Don Hall" | FL
Figure 1 shows the output from
this command.
Even for a single mailbox you obtain a significant amount of information, and
you might find it convenient to redirect the output of
Get-MailboxStatistics commands to a text file. The
following example places the statistics for the Don Hall Mailbox in the file
donstats.txt in the folder C:\MailboxStats on the server on which the command is
run:
Get-MailboxStatistics -Identity "Don Hall" | FL > C:\MailboxStats\donstats.txt
Note that if the file donstats.txt did not already exist, this command would
create it. However, the folder C:\MailboxStats must already exist; otherwise,
the command returns an error.
Running the Get-MailboxStatistics cmdlet against a
mailbox and piping the result into the FL cmdlet helps
identify the names of the mailbox statistics that the cmdlet returns, for
example, ItemCount, LastLogonTime, LastLogoffTime, TotalItemSize, ServerName,
DatabaseName, and so on. If you want to return the values of only the statistics
you are interested in, you can use these names (known as attribute identifiers)
with the FL cmdlet. For example, the following command
returns the display name, total item size, and item count for the Don Hall
mailbox:
Get-MailboxStatistics -Identity "Don Hall" | FL DisplayName,TotalItemSize,ItemCount
1.1. Displaying Data in Tables
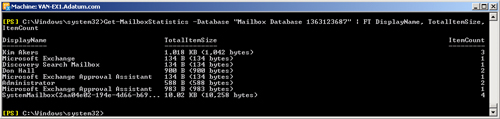
Displaying the statistics for a single mailbox in list format is usually
satisfactory, but if you are displaying several statistics for several
mailboxes, the result is typically clearer in tabular format. In this case,
you pipe the output of the Get-MailboxStatistics cmdlet
into the FT
PowerShell cmdlet. The following example lists the display name, total item
size, and item count for all the mailboxes in the mailbox database named
Mailbox Database 1363123687:
Get-MailboxStatistics -Database "Mailbox Database 1363123687" | FT DisplayName,
TotalItemSize,ItemCount
Figure 2 shows the output from
this command.
A table on an EMS screen is, however, not the best way to display a
report. You can convert the output of the
Get-MailboxStatistics cmdlet to CSV format by using
the Export-CSV PowerShell cmdlet and storing the output
in a CSV file. You can then display or manipulate the file by using software
that reads CSV files, such as Microsoft Excel. The following command creates
the file MailboxStats.csv in the C:\MailboxStats folder:
Get-MailboxStatistics -Database "Mailbox Database 1363123687" | Export-CSV
C:\MailboxStats\MailboxStats.csv
This command captures all the statistics for all the mailboxes in the
Mailbox Database 1363123687 database. Typically, you would use reporting
software to manipulate the CSV file and display the information you want to
see. Data is saved in ASCII format by default. If you want to save the data
in, for example, Unicode format, you can use the Encoding parameter followed
by the desired format, such as follows:
Get-MailboxStatistics -Database "Mailbox Database 1363123687" | Export-CSV
C:\MailboxStats\MailboxStats.csv -Encoding unicode
By default, the first line of any CSV file you create with
Export-CSV lists the .NET object type in its first
line, for example, #TYPE Microsoft.Exchange.Data.Mapi.MailboxStatistics. If
you do not want to list this information, you can specify the Notype
parameter, such as follows:
Get-MailboxStatistics -Database "Mailbox Database 1363123687" | Export-CSV
C:\MailboxStats\MailboxStats.csv -Notype
1.2. Listing Results by Statistic Values
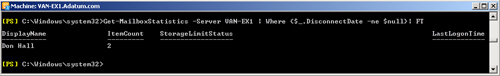
You can use the values of mailbox statistics to generate reports that list
mailboxes that meet specific conditions. For example, if you wanted a report
that gave details of all disconnected mailboxes on the Mailbox server
VAN-EX1, you could use the PowerShell Where clause, such as follows:
Get-MailboxStatistics -Server VAN-EX1 | Where {$_.DisconnectDate -ne $null}| FT
Figure 3 shows the output of this
command. (Note that the Don Hall mailbox was disconnected using the
Disable-Mailbox cmdlet before the command was
entered.)
As before, you can place the output of the previous command into a CSV
file, such as follows
Get-MailboxStatistics -Server VAN-EX1 | Where {$_.DisconnectDate -ne $null} | Export-Csv
C:\ \MailboxStats\DisconnectedMailboxes.csv -Notype
The Where clause can also be used to list all mailboxes that are greater
than or equal to a defined size or hold a defined number of messages or
more. You could, for example, list all mailboxes on a Mailbox server that
have a size of 1 GB or greater. However, on your isolated test network, it
would be most unlikely that the size of any mailbox would exceed 1 GB or
even 1 MB. Therefore, the following command lists all the mailboxes on the
Mailbox server VAN-EX1 with a total item size greater than or equal to 1
KB:
Get-MailboxStatistics -Server VAN-EX1 | Where ($_.TotalItemSize -ge 1KB) | FT
DisplayName,TotalItemSize
Figure 4 shows the
output from this command.
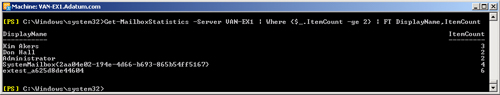
Similarly, the item counts in the mailboxes on your test network will be
much lower than they would be on a production Exchange organization. The
following command lists all the mailboxes on the Mailbox server VAN-EX1 with
an item count greater than or equal to 2:
Get-MailboxStatistics -Server VAN-EX1 | Where ($_.ItemCount -ge 2) | FT
DisplayName,ItemCount
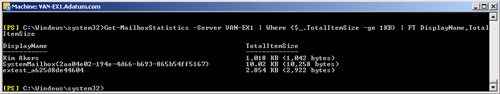
Figure 5 shows the output of
this command.
As before, you can redirect this information to a CSV file that you can
use to generate a report.
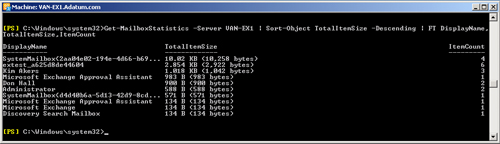
1.3. Listing Mailboxes in a Defined Order
Sometimes you do not want to know the absolute item size of mailboxes but
instead want to list them in a specified order. You can use the PowerShell
Sort-Object cmdlet, to sort mailboxes in the
order defined by a mailbox statistic, such as TotalItemSize or ItemCount. By
default, the list will be in ascending order, but you can use the Descending
parameter to order the list so that the largest values are first. For
example, to list the display name, total item size, and total item count of
the mailboxes
on the Mailbox server VAN-EX1 in descending order of total item size, you
would enter the following command:
Get-MailboxStatistics -Server VAN-EX1 | Sort-Object TotalItemSize -Descending |
FT DisplayName,TotalItemSize,ItemCount
Figure 6 shows the output
from this command. As before, you have the option of capturing this output
in a CSV file.
If you do not want to list all the mailboxes in a mailbox database or
Mailbox server (typically this would be too much information) but instead
want to list, for example, the five largest mailboxes in terms of item
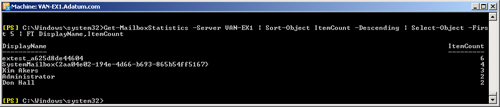
count, you can use the PowerShell Select-Object cmdlet. For
example, the following command lists the top five mailboxes on the Mailbox
server VAN-EX1 in descending order of item count:
Get-MailboxStatistics -Server VAN-EX1 | Sort-Object ItemCount -Descending | Select-
Object -First 5 | FT DisplayName,ItemCount
Figure 7 shows the output
from this command.