1. Problem
You need to debug a BizTalk orchestration.
2. Solution
You can use
BizTalk's Orchestration Debugger, which allows you to set breakpoints on
any shape in an orchestration. Once an instance of an orchestration
executes and encounters one of these breakpoints, it will go into a wait
state in the BizTalk MessageBox, allowing a developer or administrator
to manually step through the orchestration.
NOTE
A dehydrated orchestration
is an orchestration that has been removed from memory and persisted to
SQL Server while it waits for its next action to occur, such as
receiving a document. Upon this next action, the orchestration is
returned to memory in the exact state prior to dehydration, and
processing continues. This ability to dehydrate/rehydrate allows BizTalk
Server to better utilize server resources.
The following steps demonstrate setting how to debug an orchestration.
Open the BizTalk Administration Console, and navigate to the BizTalk Group Hub page.
Find
an instance of a currently running orchestration that you wish to
debug, or find a completed instance of an orchestration that you wish to
debug future instances of. For this example, click on the Completed
Instances link on the Group Hub page, which will show a list of all
instances (orchestrations and otherwise) that have completed.
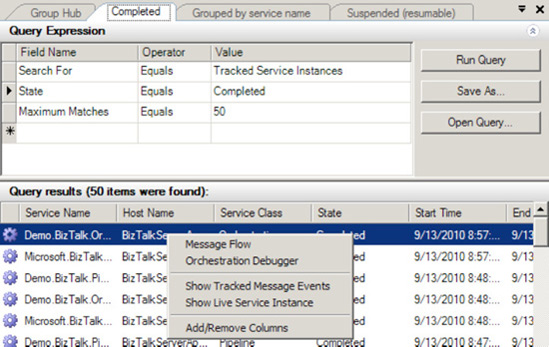
Right-click the instance of the orchestration to debug, and select Orchestration Debugger, as shown in Figure 1.
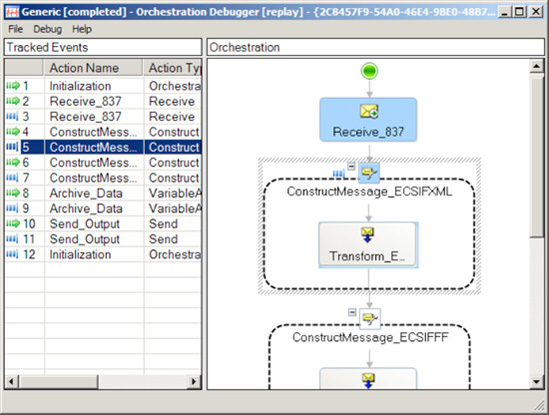
The Orchestration Debugger window will open. The full orchestration
will appear with a pane on the left showing a list of tracked events, as
shown in Figure 2.
NOTE
Large orchestrations can
take longer to load. Occasionally, with smaller development machines and
larger orchestrations, you may need to wait for a while before the
Orchestration Debugger window actually opens.
To set a breakpoint, right-click any shape, and select Set Breakpoint on Class.
Step through the orchestration by clicking tracked events in the left pane.
At any time, select Debug =>
Attach. A new pane will open and display the values of all variables at
the given stage of the orchestration. This allows for a full view into
the state of the process. You'll notice a number of debugging actions
are available on the Debug menu.
NOTE
You can attach only to
orchestrations that have not completed. If this is the first time that
the orchestration has executed, it will likely have already completed.
You may need to start a new instance before the orchestration will pause
on a breakpoint that has been set.
Click
through the tracked events in the left pane to see which steps have
executed by highlighting the corresponding orchestration shapes in the
right pane. The color green indicates input to a shape, and blue
indicates an exit from a shape. This will aid in determining which paths
have been followed (in the case of Decide and Parallel Action shapes),
how many times they may have executed (for instance, how many times a
loop has executed), and which step in the process may be causing an
error.
If
desired, step into a child orchestration by clicking the event in the
Tracked Events pane, which corresponds to the Call Orchestration shape.
Right-click the event, and select the option to step into the child
orchestration.
Once
all debugging has been completed on an orchestration, make sure to
clear all breakpoints. Open the Orchestration Debugger on an instance of
the same orchestration (any instance will do), and select Debug => Clear All Breakpoints on Class (this can be done only when not attached to an instance).
3. How It Works
While the Orchestration
Debugger can be a helpful tool, especially in cases where an
orchestration is deployed in a production environment and is
encountering errors, developers often need a much more rapid and
controllable method for debugging. It is helpful to have logging in
development and in production, and the ability to turn it on and off for
any given process at any given time should be available. Several
techniques enable this type of debugging.
For example, using two
standard .NET lines of code will allow a view into what is happening in
an orchestration without opening the Orchestration Debugger:
System.Diagnostics.EventLog.WriteEntry("Demo","Value: " + strValue);
System.Diagnostics.Trace.WriteLine("Value: " + strValue, "Demo");
The System.Diagnostic.EventLog.WriteEntry
method will log entries to the Windows Event Viewer. To view this
logged event, open the Control Panel, select Administrative Tools, and
double-click Event Viewer. Events will be logged to the application log,
and you'll need to refresh the display to see results as they are
written.
NOTE
The user that runs the
orchestration (whatever the host user has been configured to be) must
have rights to write to the Event Viewer to use the System.Diagnostic.EventLog.WriteEntry method.
The System.Diagnostics.Trace.WriteLine
method will allow all of the trace outputs to be read by attaching to
the main BizTalk executable and monitoring in Visual Studio. Use the
following steps to do that monitoring:
In Visual Studio, select Debug => Attach to Process.
In the window that opens, find BTNTSvc.exe, and highlight it. Click the Attach button.
Run an instance of the orchestration. Trace information will be made available in the Output window in Visual Studio.
One way to use the System.Diagnostic methods for debugging/tracing in orchestrations is to wrap the logging code in an If statement and create a TraceFlag that can be set in a configuration file, such as the BTSNTSvc.exe.config file in the root BizTalk Program Files folder. Here is an entry you could add to the BTNTSvc.exe.config file:
<add key=" TraceFlag" value="true"/>
Listing 1 demonstrates how to retrieve the TraceFlag and, based on its value, log information.
Example 1. Configurable Trace Flag
// set the trace flag based on a value stored in the BizTalk Config File
// note that blnTraceFlag must be defined in the orchestration variables


blnTraceFlag = System.Convert.ToBoolean(System.Configuration.
ConfigurationSettings.AppSettings.Get("TraceFlag"));

// set the source to something unique for this orchestration
strSource = "DebugDemoOrchestration";

// Trace
if(blnTraceFlag == true){
strValue = System.Convert.ToString(intValue);
System.Diagnostics.EventLog.WriteEntry(strSource,"Value: " + strValue);
System.Diagnostics.Trace.WriteLine("Value: " + strValue, strSource);
}
|
When using this approach, keep
tracing information separate in the orchestration from other
functionality, and label it appropriately. You can do this by dedicating
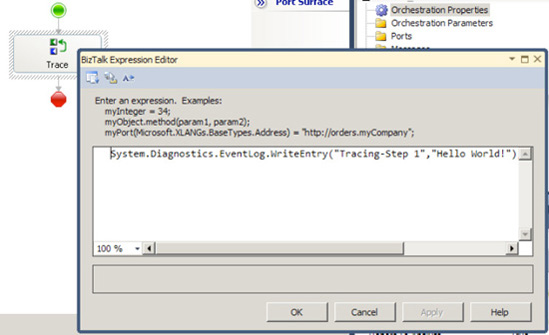
an Expression shape to a single trace event and naming it Trace (for example), as shown in Figure 3.
One of the most helpful
ways to debug is to see the actual XML of a message, especially before
and after mapping. This can be done by setting a variable of type System.Xml.XmlDocument equal to an orchestration message and then tracing the value of this variable, as shown in Listing 2.
Example 2. Tracing XML
// set the xmlDoc variable equal to the message to be traced.
// msgOrch is an orchestration message
xmlDoc = new System.Xml.XmlDocument();
xmlDoc = msgOrch;
System.Diagnostics.EventLog.WriteEntry(strSource,"Value: " + xmlDoc.OuterXml);
System.Diagnostics.Trace.WriteLine("Value: " + xmlDoc.OuterXml, strSource);
|
NOTE
The maximum size of a
string that can be written to the Windows Event Viewer is 32KB. Often,
XML messages will exceed this size. If a string longer than 32KB is
written, an exception will be thrown, and the orchestration will
terminate (unless appropriate exception handling is implemented). You
can truncate the length using .NET code. There is no limitation to the
size when using the Trace.WriteLine method.
