.7. Using the Microsoft Exchange Best Practices Analyzer (ExBPA) to Create
Reports
The ExBPA is an EMC tool that helps you determine the
overall health of your Exchange Server 2010 servers and check their topology.
You can access this tool from the EMC by clicking the Toolbox node, clicking
Best Practices Analyzer, and then clicking Open Tool. It scans Exchange Server
2010 servers and identifies items that do not conform to Microsoft best
practices. ExBPA automatically examines the Exchange Server 2010 deployment and
determines whether the configuration is set according to Microsoft best
practices.
ExBPA can examine your Active Directory and Exchange Server 2010 servers and
generate a list of issues, such as suboptimal configuration settings or
unsupported or not-recommended options. You can also use it to report on the
general health of a system.
You
can run ExBPA against an entire deployment, against a specific server, or
against a set of servers. When you open ExBPA for the first time, you have the
option of selecting to automatically check whether updates to the tool are
available (the default) and whether to join the Microsoft Customer Experience
Improvement Program. On your isolated test network, you should select not to
check for updates and not to join the Customer Experience Improvement Program.
On a production network, your settings should be the opposite. When you have
configured these settings, you can click Check For Updates Now or Go To The
Welcome Screen.
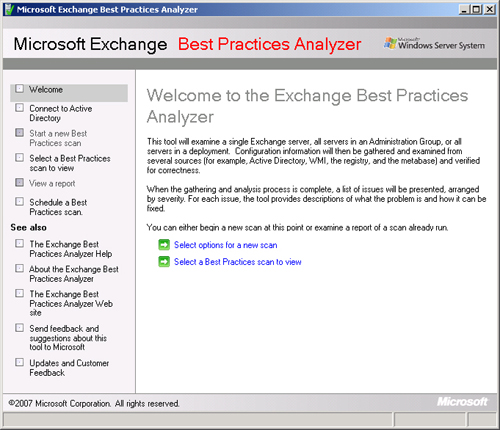
On the Welcome screen, shown in Figure 17, you
have the choice of carrying out a new scan or accessing an existing scan.
7.1. Reporting on an Existing Scan
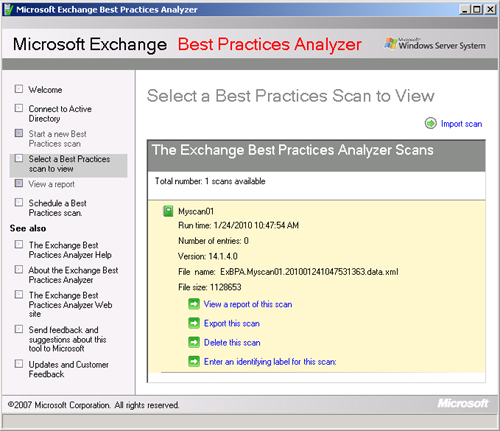
If one or more scans already exist, you can enable the reporting features
of ExBPA. Choose to access an existing scan and then select the scan you
want to view. You can then click View A Report Of This Scan, as shown in
Figure 18.
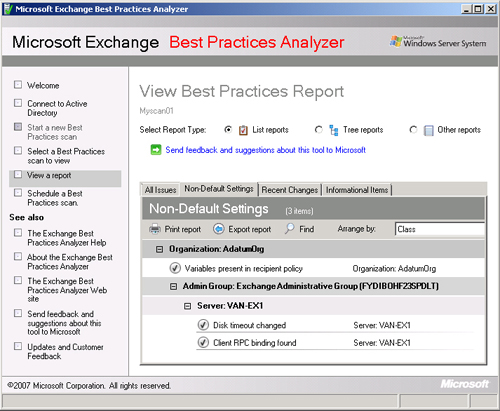
On the View Best Practices Report page, you can select List Reports, Tree
Reports, and Other Reports. If you select List Reports, you can view
Critical Issues, All Issues, Non-Default Settings, Recent Changes, or
Informational Items. List Reports can be arranged by Class, Severity, or
Issue. If you select Tree Reports, you can access Detailed View or Summary
View tabs. Figure 19 shows
a List Report with All Issues selected.
If you select Other Reports, you can
access the Run Time Log or Hidden Items. For example, some critical issues,
such as Unrecognized Exchange Signature, can appear in List Reports, and you
can choose not to display them, an unrecognized Exchange signature can be
caused by the version of DomainPrep that was last run, and you can
reasonably choose to ignore this message in Critical Issues of List Reports,
but if you do so, this is recorded under Hidden Items in Other
Reports.
If you click Export Report, you can export reports as Hypertext Markup
Language (HTML), CSV, or Extended Markup Language (XML) files. HTML and CSV
files contain only the information on the displayed tab of the report. XML
files contain all the information in the report.
7.2. Carrying Out a Scan
If you are carrying out a scan rather than generating a report from a
previous scan, you can specify the type of scan ExBPA carries out. If you
select Health Scan, you have the option of specifying Performance Baseline.
Typically, this adds two hours to the time taken by the scan. Figure 20 shows this option.
You can also specify the speed of your local or wide area network. At the
foot of the screen (not shown in the figure), you can specify whether to
start scanning immediately or to schedule a Best Practices scan. When
scanning is complete, you can click View A Report Of This Best Practices
Scan if you want to view the report immediately.
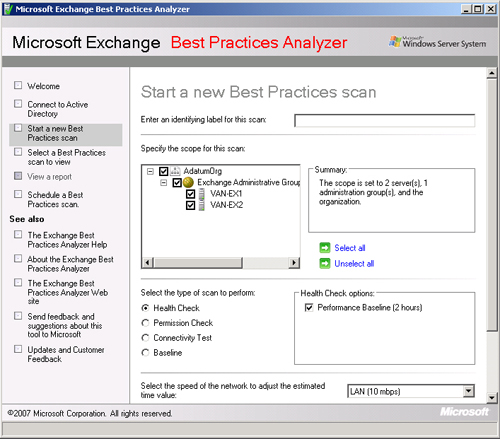
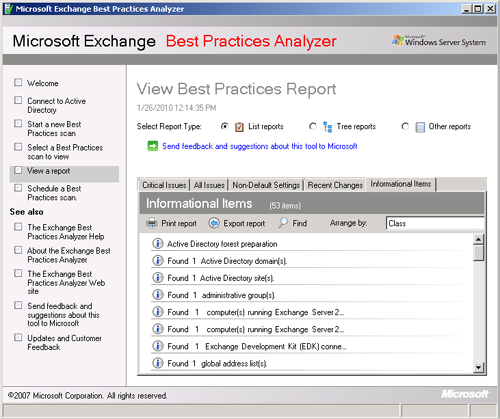
Figure 21 shows part of the
extensive list of items on the Informational Items tab of a performance
baseline List Report. You would typically capture a performance baseline
after you first install Exchange Server 2010 or if you make any major
changes to the software, Exchange organization, or network
infrastructure.
You can use ExBPA to carry out one of the following types of scans:
If you carry out a health check without specifying the Performance
Baseline option, then the scan takes less time and returns fewer items. You
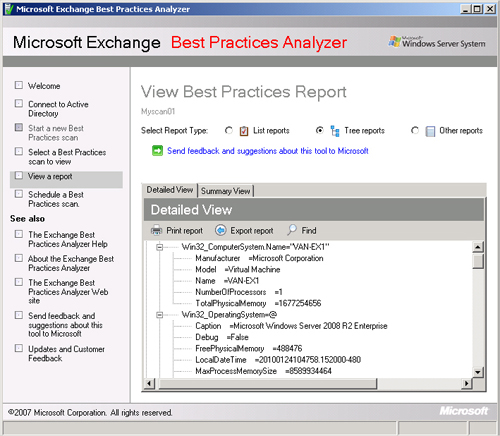
should carry out such scans on a regular basis. Figure 22 shows the Detailed
View tab of the report type Tree Reports for a health scan without the
Performance Baseline option.
Figure 22. Detailed view of a health report in ExBPA
Note:
It is not unusual for
an examination question to ask what tools perform a particular function
and list both EMS commands and the EMC graphic tools in the answers. You
should know, for example, that you can test mail flow using both the
Test-Mailflow cmdlet and the Mail Flow
Troubleshooter.
8. Obtaining Exchange ActiveSync Reports
When you install the Client Access server (CAS) role on a computer running
Microsoft Exchange Server 2010, you enable Microsoft Exchange ActiveSync. This
feature lets users synchronize their mobile phones with their Exchange 2010
mailboxes. This enables a user to access email, calendar, contacts, and tasks
and to continue to be able to access this information while working
offline.
You can perform the following Exchange ActiveSync administrative tasks:
Enable and disable Exchange ActiveSync for individual users
Set policies such as minimum password length, device locking, and
maximum failed password attempts
Initiate a remote wipe to clear all data from a lost or stolen mobile
phone
Generate a variety of reports for viewing or exporting into reporting
software
Exchange ActiveSync reporting is a Windows PowerShell task that compiles a set
of Internet Information Services (IIS) logs and processes to create a series of
reports. You can generate Exchange ActiveSync reports using the
Export-ActiveSyncLog EMS cmdlet that exports the
information in the ActiveSync log, which in turn generates a series of reports.
Available ActiveSync reports include the following:
Exchange ActiveSync usage
report
This report includes the total bytes that were sent and received
and a count of each type of item sent and received. Item types
include email messages, calendar items, contact items, and task
items.
Hits report
This report tells you the total number of synchronization requests
processed per hour and the total number of unique devices that are
initiating synchronization requests.
HTTP status report
This report provides an overview of the CAS server performance. It
includes a summary of the different error response codes and how
often each code was generated.
Policy compliance
report
This report provides information about the number of fully
compliant, partially compliant, and noncompliant devices. A fully
compliant device is one that has accepted the Exchange ActiveSync
policy and can implement all aspects of the policy. A partially
compliant device is one that has accepted the policy but has a
mobile device operating system that is unable to enforce all aspects
of the policy. A noncompliant device is either unable to accept the
policy or has rejected the policy.
User agent list This report returns the total number of unique users,
organized by a mobile phone operating system.
The Export-ActiveSyncLog cmdlet lets you specify input
parameters such as the location of the IIS log files, the start dates and the
end dates for the reports, and the location of the reports folder. For example,
the following command exports the ActiveSync log for the date range 03/09/10 to
03/11/10. The times are in Coordinated Universal Time (UTC), and the reports are
saved in C:\Reports\ActiveSyncReports:
Export-ActiveSyncLog -Filename: "C:\Windows\System32\LogFiles\W3SVC1\ex030910.log"
-StartDate:"03/09/10" -EndDate:"03/11/10" -UseGMT:$true -OutputPath:"C:\Reports\
ActiveSyncReports"
Note that the file C:\Windows\System32\LogFiles\W3SVC1\ex030910.log and the
folder C:\Reports\ActiveSyncReports must exist; otherwise, the command returns
an error. For example, you cannot generate reports if no ActiveSync devices are
synchronized with your server.