| |
|
|
|
Exchange Server 2010 : Monitoring Events, Services, Servers, and Resource Usage (part 2) - Monitoring Exchange Messaging Components & Using Performance Alerting
|
|
|
|
|
|
|
|
|
4/18/2012 3:54:39 PM
|
|
3. Monitoring Exchange Messaging Components
When you are troubleshooting or optimizing a server for performance, you can use performance
monitoring to track the activities of Exchange messaging components.
Performance Monitor graphically displays statistics for the set of
performance parameters you've selected for display. These performance
parameters are referred to as counters.
Performance Monitor displays information for only the counters you're
tracking. Thousands of counters are available, and these counters are
organized into groupings called performance objects.
When you install Exchange
Server 2010 on a computer, Performance Monitor is updated with a set of
objects and counters for tracking Exchange performance. These objects
and counters are registered during setup in the Win32 performance
subsystem and the Windows registry. You'll find dozens of related
performance objects for everything from the Microsoft Exchange
Availability Service to the Microsoft Exchange Journaling Agent to
Microsoft Exchange Outlook Web App.
You can select which counters you want to monitor by completing the following steps:
In
the Exchange Management Console, select the Toolbox node, and then
double-click Performance Monitor. This opens the Exchange Server
Performance Monitor, which is a custom console with several preselected
objects and counters. You also can start Performance Monitor by
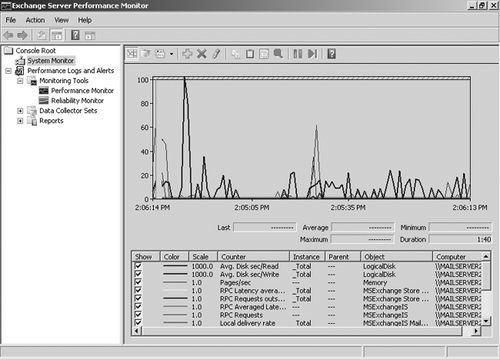
selecting the related option on the Administrative Tools menu. Select the System Monitor entry in the left pane, as shown in Figure 3. The
Performance Monitor tool has several views and view types. Ensure that
you are viewing current activity by clicking View Current Activity on
the toolbar or pressing Ctrl+T. You can switch between the view types
(Line, Histogram Bar, and Report) by clicking the Change Graph Type
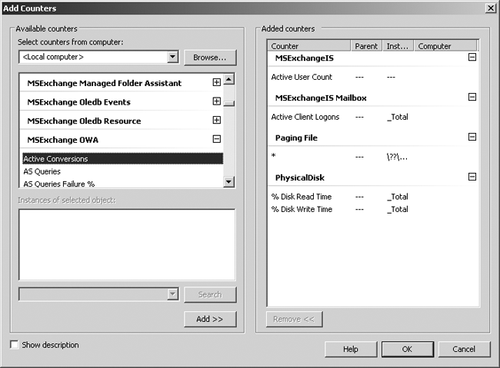
button or pressing Ctrl+G. To add counters, click Add on the toolbar. This displays the Add Counters dialog box shown in Figure 4.


In
the Select Counters From Computer combo box, enter the Universal Naming
Convention (UNC) name of the Exchange server you want to work with,
such as \\MailServer18, or leave it at the default setting of <Local computer> to work with the local computer.
Note:
You need to be at least a member of the Performance
Monitor Users group in the domain or the local computer to perform
remote monitoring. When you use performance logging, you need to be at
least a member of the Performance Log Users group in the domain or the
local computer to work with performance logs on remote computers.
In
the Available Counters panel, Performance Objects are listed
alphabetically. If you select an object entry by clicking it, all
related counters are selected. If you expand an object entry, you can
see all the related counters and you can then select individual counters
by clicking them. For example, you can expand the entry for the
MSExchangeIS object and then select the Active User Count, Client RPCs
Attempted/Sec, Connection Count, and RPC Operations/Sec counters. When
you select an object or any of its counters, you see the related
instances, if any. Choose All Instances to select all counter instances
for monitoring. Or select one or more counter instances to monitor. For
example, you can select the Exchange ActiveSync or Exchange Content
Indexing instances of MSExchangeIS Client. When
you've selected an object or a group of counters for an object as well
as the object instances, click Add to add the counters to the graph.
Repeat steps 5 through 8 to add other performance parameters. Click
OK when you're finished adding counters. You can delete counters later
by clicking their entry in the lower portion of the Performance window
and then clicking Delete.
4. Using Performance Alerting
In Windows Server 2008, Data
Collector Sets are used to collect performance data. When you configure
Data Collector Sets to alert you when specific criteria are met, you
are using performance alerting. Windows performance alerting provides a
fully automated method for monitoring server performance and reporting
when certain performance thresholds are reached. You can use performance
alerting to track the following:
Memory usage CPU utilization Disk usage Messaging components
Using notifications, you can then provide automatic notification when a server exceeds a threshold value.
4.1. Tracking Memory Usage
Physical and virtual memory
is critical to normal system operation. When a server runs low on
memory, system performance can suffer and message processing can grind
to a halt. To counter this problem, you should configure performance
alerting to watch memory usage. You can then increase the amount of
virtual memory available on the server or add more random access memory
(RAM) as needed.
You configure a memory alert by completing the following steps:
In
the Exchange Management Console, click the Toolbox node, and then
double-click Performance Monitor. This opens the Exchange Server
Performance Monitor. Expand
the Performance Logs And Alerts and the Data Collector Sets nodes, and
then select User Defined. You should see a list of current alerts (if
any) in the right pane. Right-click the User-Defined node in the left pane, point to New, and then choose Data Collector Set. In the Create New Data Collector Set Wizard, type a name for the Data Collector Set, such as Memory Usage Alert. Select the Create Manually option and then click Next. On
the What Type Of Data Do You Want To Include page, the Create Data Logs
option is selected by default. Select the Performance Counter Alert
option and then click Next. On
the Which Performance Counters Would You Like To Monitor page, click
Add. This displays the Add Counter dialog box. Because you are
configuring memory alerts, expand the Memory object in the Performance
Object list. Select Available Mbytes by clicking it, and then click Add. Expand
the Paging File object in the Performance Object list. Click %Usage. In
the Instances Of Selected Object panel, select _Total, and then click
Add. Click OK. On
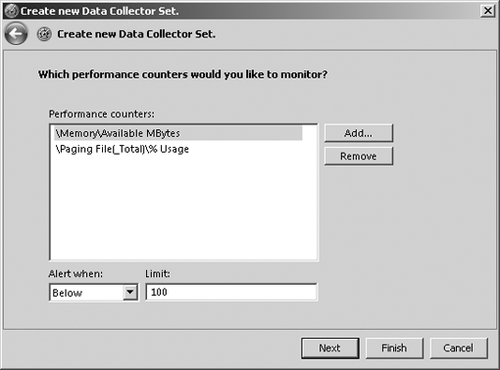
the Which Performance Counters Would You Like To Monitor page, you'll
see the counters you've added. In the Performance Counters panel, select
Available Mbytes (as shown in Figure 5),
set the Alert When list to Below, and then enter a Limit value that is
approximately 5 percent of the total physical memory (RAM) on the server
for which you are configuring alerting. For example, if the server has 2
GB of RAM, you set the value to 100 MB to alert you when the server is
running low on available memory. In the Performance Counters panel, select %Usage. Set the Alert When list to Above, and then type 98 as the Limit value. This ensures that you are alerted when more than 98 percent of the paging file is being used. Click Next and then click Finish. This saves the Data Collector Set and closes the wizard. In
the left pane, select the related Data Collector Set and then
double-click the data collector for the alert in the main pane. This
displays the data collector Properties dialog box.

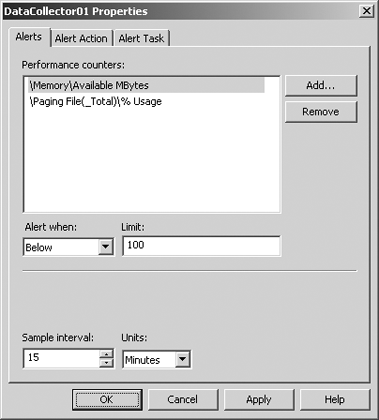
On the Alerts tab, use the Sample Interval options to set a sample interval. (See Figure 6.)
The sample interval specifies when new data is collected. Don't sample
too frequently, however, because you'll use system resources and might
cause the server to seem unresponsive. By default, Performance
Monitor checks the values of the configured counters every 15 seconds. A
better value might be once every 10 to 30 minutes. Generally, you'll
want to track performance periodically over several hours at a minimum
and during a variety of usage conditions.

If
you want to log an event rather than be alerted every time an alert
limit is reached, on the Alert Action tab, select the Log An Entry In
The Application Event Log check box. Selecting this option ensures that
an event is logged when the alert occurs but does not alert you via the
console. Click
OK to close the Properties dialog box. By default, alerting is
configured to start manually. To start alerting, select the User Defined
node in the left pane, click the alert in the main pane to select it,
and then click the Start button on the toolbar.
To manage an alert, select the User Defined node in the left pane, right-click the alert in the main pane, and then select one of the following options:
4.2. Tracking CPU Utilization
You can use a CPU utilization alert to track the usage
of a server's CPUs. When CPU utilization is too high, Exchange Server
can't effectively process messages or manage other critical functions.
As a result, performance
can suffer greatly. For example, CPU utilization at 100 percent for an
extended period of time can be an indicator of serious problems on a
server. To recover, you might need to use Task Manager to end the
process or processes with high CPU utilization, or you might need to
take other corrective actions to resolve the problem, such as closing
applications you are running while logged on to the server.
You'll also want to closely track process
threads that are waiting to execute. A relatively high number of
waiting threads can be an indicator that a server's processors need to
be upgraded.
You configure a CPU utilization alert by completing the following steps:
In
the Exchange Management Console, click the Toolbox node, and then
double-click Performance Monitor. This opens the Exchange Server
Performance Monitor. Expand
the Performance Logs And Alerts and Data Collector Sets nodes, and then
select User Defined. You should see a list of current alerts (if any)
in the right pane. Right-click the User-Defined node in the left pane, point to New, and then choose Data Collector Set. In the Create New Data Collector Set Wizard, type a name for the Data Collector Set, such as CPU Utilization Alert. Select the Create Manually option and then click Next. On
the What Type Of Data Do You Want To Include page, the Create Data Logs
option is selected by default. Select the Performance Counter Alert
option and then click Next. On the Which Performance
Counters Would You Like To Monitor page, click Add. This displays the
Add Counter dialog box. Because you are configuring CPU alerts, expand the Processor object in the Performance Object list. Click % Processor Time. In the Instances Of Selected Object panel, select _Total and then click Add. Expand the System object in the Performance Object list. Click Processor Queue Length, and then click Add. Click OK. On
the Which Performance Counters Would You Like To Monitor page, you'll
see the counters you've added. Select % Processor Time. Then set the
Alert When list to Above, and type 98 as the Limit value. This ensures that you are alerted when processor utilization is more than 98 percent. In the Performance Counters panel, select Processor Queue Length. Then set the Alert When list to Above, and type 3
as the Limit value. This ensures that you are alerted when more than
three processes are waiting to execute, which can be an indicator that a
server's processors need to be upgraded. Click Next and then click Finish. This saves the Data Collector Set and closes the wizard. Finish configuring the alert by following steps 11 through 14 under Section 4.1.
4.3. Tracking Disk Usage
Exchange Server uses disk
space for data storage, logging, tracking, and virtual memory. To ensure
there is always ample disk space available, Exchange Server monitors free
disk space. If free disk space drops below specific thresholds,
Exchange will gracefully shut itself down. When Exchange is in this
state, it is likely that data could get lost. To prevent serious
problems, you should monitor free disk space closely on all drives used
by Exchange Server.
You'll also want to track closely the number of system
requests that are waiting for disk access. A relatively high value for a
particular disk can affect server performance and is also a good
indicator that a disk is being overutilized or that there may be some
problem with the disk. To resolve this problem, you'll want to try to
shift part of the disk's workload to other disks, such as by moving
databases, logs or both.
You configure disk usage alerting by completing the following steps:
In
the Exchange Management Console, click the Toolbox node, and then
double-click Performance Monitor. This opens the Exchange Server
Performance Monitor. Expand
the Performance Logs And Alerts and Data Collector Sets nodes, and then
select User Defined. You should see a list of current alerts (if any)
in the right pane. Right-click the User-Defined node in the left pane, point to New, and then choose Data Collector Set. In the Create New Data Collector Set Wizard, type a name for the Data Collector Set, such as Disk Usage Alert. Select the Create Manually option and then click Next. On the What Type Of Data Do You Want To Include page, the Create Data Logs option is selected by default. Select the Performance Counter Alert option and then click Next. On
the Which Performance Counters Would You Like To Monitor page, click
Add. This displays the Add Counter dialog box. Because you are
configuring disk alerts, expand the LogicalDisk object in the
Performance Object list. Click % Free Space. In the Instances Of
Selected Object panel, select all individual logical disk instances
except _Total and then click Add. Expand
the PhysicalDisk object in the Performance Object list. Click Current
Disk Queue Length. In the Instances Of Selected Object panel, select all
individual physical disk instances except _Total and then click Add.
Click OK. On
the Which Performance Counters Would You Like To Monitor page, you'll
see the counters you've added. Select the first logical disk instance,
set the Alert When list to Below, and then type 5
as the Limit value. This ensures that you are alerted when available
free space is less than 5 percent. Repeat this procedure for each
logical disk. In the Performance Counters panel, select the first physical disk instance, set the Alert When list to Above, and then type 2
as the Limit value. This ensures that you are alerted when more than
two system requests are waiting for disk access. Repeat this procedure
for each physical disk. Click Next and then click Finish. This saves the Data Collector Set and closes the wizard. Finish configuring the alert by following steps 11 through 14 under Section 14.1.
|
|
|
|
|
|
|
|
|
| Related ----------------- |
|
|
|
|
|
|
|
|
|
| |
|
|