Visually Mapping the
Governance Strategy
To prepare for the more
formal documentation step, it is useful to visualize the overall plan,
which will help provide shape to the plan of action and map the logical
components of hardware, software, people, and processes to the different
areas of functionality that will be implemented in the project. Figure 1 provides a sample visualization tool for a
governance plan for a sample organization, Company ABC.
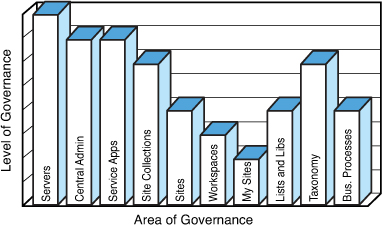
One way to define this
diagram is to call it an “equalizer” chart, referring to the piece of
audio hardware, not something more colloquial. This brings to mind the
process of determining different “settings” for the components that
comprise the SharePoint 2010 environment and then adjusting the
individual settings as time goes by to “tune” the overall levels of
governance. A distinction to make at this point in the governance
process (brainstorming) is that the chart is driving the output rather
than data driving the chart. For example, if the IT department is locked
in a room working on this chart together, the CIO might simply say, “We
don’t have budget for new staff or any additional software and we’re
not supporting My Sites.” That would immediately result in the removal
of the My Site component from the chart and “shorten” the bars across
the board because the component of support resources is reduced.
To further understand how this
chart can be useful, review Figure 1 in more detail. It is suggested that on the far left, the
bar that represents governance of the servers that support the
SharePoint environment (for example, Windows 2008 servers, including one
or more SQL servers and one or more SharePoint 2010 servers) represents
a maximal level of governance. Company ABC governs these servers very
carefully, fully realizing that if they aren’t stable, the entire
environment will suffer. Therefore, the bar takes up the full height (or
ranks an 8 of 8 in governance). To be more specific, there are
standards for the operating system configuration in place, as well as
for which version of Windows Server will be installed, how patches are
applied, and antivirus use. Standards are also in place for backup
software, maintenance plans for the SQL databases, as well as strict
controls over which Active Directory (AD) groups and users have
permissions to manage these servers.
Moving to the right in Figure 1, the Central Administration site will also be
tightly controlled in terms of the configuration of the various
components, such as web applications, jobs, reporting, and groups and
accounts, that can make changes, and ranks a 7 out of 8. The service
applications will be governed at a similar level. Site collections will
be slightly less controlled and governed (6 of 8), sites still less (4
of 8), workspace still less (3 of 8), and My Site sites the least (2 of
8). The lists and libraries will be governed to a medium degree, while
the overall taxonomy more highly managed and business processes (which
include workflows) in the medium range.
Note
The level of governance for
each area on this chart carries with it an element of cost and level of
effort, both one-time (such as purchasing third-party software or hiring
administrators) and over the long term (time to use the software,
update policies, enforce procedures). It should be considered that the
level of risk in each area grows inversely to the level of governance.
Consider, for example, a SharePoint 2010 environment where the servers
that house SQL Server and the SharePoint 2010 software are not managed,
not backed up, and open for many users to modify the settings. Most
people would agree that is a riskier configuration than the alternative.
Continuing with this
visualization, each bar on the chart can be broken down into components,
including the following:
Resources involved in the governance
process— This should include
full-time and part-time resources as well as consultants and
contractors.
Level of security and privilege constraints
implemented— A higher level of security
translates to added governance, or control over the specific area that
generally requires more time to manage than “looser” controls.
Templates
used for creating the site collection, site, list, workflow, and other
components— Templates take time to
create, manage, and update, as well as time to verify they are in fact
being used.
Reporting and auditing to track events and
activities— This includes
the built-in tools in the operating system, Internet Information
Services (IIS), and SharePoint 2010, and can include third-party tools
such as Microsoft System Center Operations Manager and products from
AvePoint, Quest, or other third party.
Policies and procedures to
define acceptable usage of the resources—
These can be enforced to a certain degree by the tools in place
(SharePoint and third party, group policies, and so forth), but these
also need to be documented and communicated to the user community and at
some level enforced.
Third-party tools to add functionality— Besides the possibilities mentioned previously,
third-party tools can be used to add functionality to SharePoint 2010 in
every conceivable area, or tools (such as new web parts) can be created
internally.
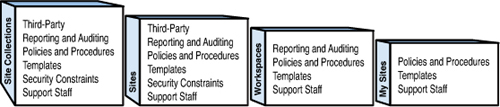
Figure 2 gives an example of what generates the “height” of several
sections of the chart, which should be translated as “cost and level of
effort.” In this example, starting at the right, the My Site
environment will be minimally governed at Company ABC. Support staff is a
fixed number, but no additional training will be provided to them on My
Site support, the basic out-of-the-box templates will be provided, but
no new ones created, and policies and procedures on My Site usage will
be loosely defined, to essentially clarify that users can do what they
want within the constraints of the software. Moving to the left,
workspaces will be allowed, which translates to users having
self-service site creation privileges, and the regular templates for
meetings and document workspaces will be provided. The policies and
procedures for using the sites will be loosely defined, and
out-of-the-box auditing and reporting will be in place. However, IT will
not be responsible for policing or cleaning up idle or abandoned
workspaces. Moving to the Sites column shows a higher level of
governance where the governance items security constraints and
third-party tools have been added, increasing the level of governance.
IT wants to strictly control privileges for the sites themselves that
house the workspaces, lists, and libraries that users will be using.
Finally, to the far left, the site collections will have additional
constraints and auditing tools in place. IT will track carefully the
different levels of usage of the site collections (as opposed to the
sites themselves, which won’t be as carefully managed) and have tools in
place to manage the site collections.
Defining Governance
Roles and Responsibilities
One of the more
important things to ensure success in SharePoint 2010 governance is to
ensure that the roles and responsibilities of the parties involved are
well defined not only in the rollout, but in the day-to-day processes in
a SharePoint deployment and its maintenance. It is often underestimated what the day-to-day maintenance
will be for the “steady-state” deployment of SharePoint.
Often, the emphasis is placed on
the IT administrator, whereas little emphasis is placed on necessary
business roles, designer roles, or even IT support structures. It’s
common to find entire roles undefined and failures can definitely happen
as a result.
To start with, the
organization should define the SharePoint farm administrator and site
collection administrators. Key stakeholders, project managers, and
business analysts can also add value to the governance process. For
example, defining a “SharePoint steering committee chairperson” and
“taxonomy tzar” can enhance the involvement of individuals in specific
areas of the ongoing maintenance of the SharePoint 2010 environment.
Members of the SharePoint steering committee may not be technical in
nature, but will bring their individual perspectives to the process and
help drive adoption of the technologies (and often, funding for specific
initiatives).
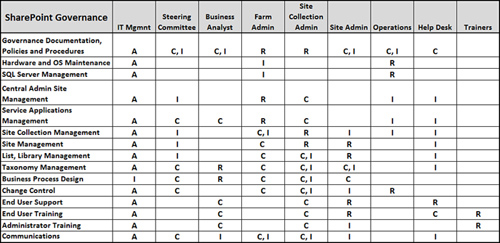
Many organizations use a
RACI charting strategy, which stands for responsible, accountable,
consulted, and informed. A RACI chart is a simple and powerful vehicle
for communication. It is used for defining and documenting
responsibility. For each aspect of the project, both the initial rollout
and the day-to-day management should have the people and their roles
identified as well as the level of their involvement. This helps keep
resources focused on their tasks and levels of involvement and typically
enhances communications paths. Often, roles and responsibilities cross
group and team lines. Figure 3 provides a sample RACI table for Company ABC.