One of the main reasons that organizations track
opportunities in Microsoft Dynamics CRM is to allow managers and
executives to forecast upcoming and future business. As you saw in the
previous section, you can record the potential customer’s name, the
products or services they’re interested in purchasing, the estimated close
date, estimated revenue, and probability for each opportunity. By using
these data points, sales managers can review the open opportunities to
ensure that orders can be fulfilled and understand which sales
representatives are generating new sales pipelines.
Tip:
To record the
sales representative pursuing the opportunity, assign the sales
representative as the owner of the opportunity record.
Microsoft Dynamics CRM includes several system views for opportunities, including:
Opportunities closing next month.
Opportunities opened last week.
Opportunities opened this week.
You can use the Advanced
Find tool to modify these views, or you can create new views to analyze
your opportunity information.
In addition to
opportunity views, Microsoft Dynamics CRM provides additional reports,
charts, and dashboards that you can use to analyze your sales
information, such as the following:
The Sales Activity dashboard
The Sales Performance dashboard
The Top Customers chart
The Sales Leaderboard chart
The Deals Won vs. Deals Lost chart
The Sales Pipeline report
The Lead Source Effectiveness report
The Competitor Win Loss report
If none of these reports
or analysis tools meet your needs, you can create new reports, charts,
and dashboards yourself.
Lastly, you can perform ad hoc opportunity reporting and forecasting by exporting your opportunity data into Microsoft Excel.
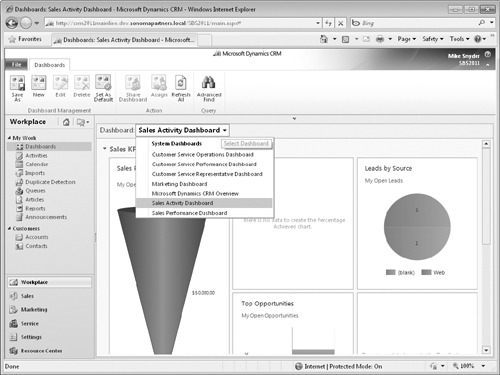
In this exercise, you will open the Sales Activity dashboard and then view the Sales Pipeline chart.
Note:
SET UP
Use the Internet Explorer web browser to navigate to your Microsoft
Dynamics CRM website, if necessary, before beginning this exercise. Your
reports will appear different than the images in this exercise, because
your Microsoft Dynamics CRM database contains different opportunities.
In the application area, click Workplace.
Under My Work in the application area, click Dashboards.
Click the arrow in the view selector and select Sales Activity Dashboard. The dashboard will update to show various charts and lists related to sales activity at your organization.
In the application area, click Sales, and then click Opportunities.
If the chart is not already displayed, click the arrow at the top of the chart section to display the chart.
Click the chart name to view a list of available charts, and select Sales Pipeline.
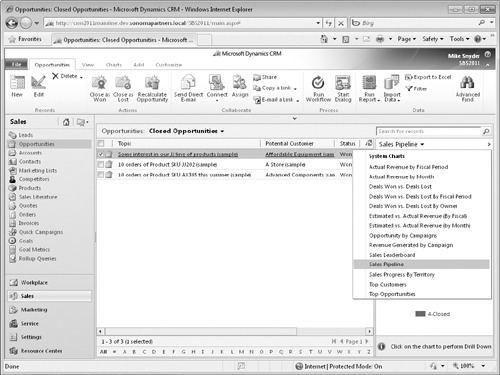
Microsoft
Dynamics CRM displays the sales pipeline chart. Note that the data
displayed in the chart varies depending on the selected view in the
Opportunity grid.
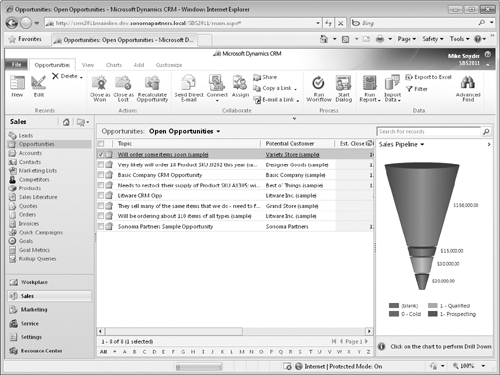
To update the chart, click the view name and select a different view, such as My Open Opportunities.
