Processing Analysis Services dimensions and
partitions is a resource-intensive operation. It should use all of the
resources—CPU, memory, and disk I/O - available to Analysis Services.
For this reason, it is important to be able to understand the impact of
process operations on the operating system.
When a database goes into
production, Analysis Services processing usually takes place on a rigid
schedule. We should monitor processing for two reasons:
Optimize processing times usually we want to reduce the time required to process partitions and dimensions
Check for any increase in the processing window over time
the amount of time processing takes could increase over time,
especially if we are running a Full Process on our database. We want to
ensure that the amount of time processing takes won't exceed our
assigned processing timeslot. To do that, we need to log information
about the start and finish time of each processing operation, as well as
details on the number of rows processed too, if possible.
Analysis Services doesn't
provide a ready-to-use logging system for processing operations.
However, there are a number of ways to gather this data and make it
available for analysis.
Monitoring processing with trace data
Analysis Services
generates trace data about its internal operations. This data allows us
to analyze the start and end times of many operations, including
processing operations. There are several tools that we can use to
retrieve this data.
SQL Server Profiler
The first tool we'll look at is
the SQL Server Profiler, which despite its name is a tool that can
collect both SQL Server and Analysis Services trace data. After
connecting to Analysis Services to initiate a new trace session, we have
to choose the events we want to capture and where to save them (for
example, either to a file or to SQL Server table).
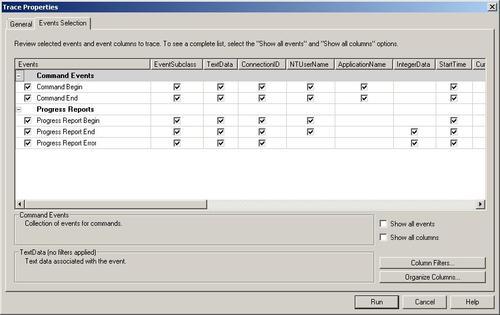
The events that we need to monitor for processing operations are shown in the following screenshot:

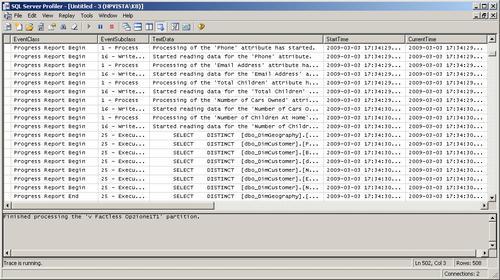
The events chosen in a profiling session are in fact classes of events.
For each class there are many actual events that can be generated, and
these are shown in the EventSubClass column in Profiler:

Looking at these events in
Profiler itself is not particularly easy, and so saving trace data to a
SQL Server table is a good idea since it allows us to query and report
on it much more easily. We can save a captured trace session by using
the File | Save As | Trace Table... menu or we can choose to save a trace session in advance by using the Save to table option in the Trace Properties dialog box that is shown when we define a new trace session.
The trace events that we are
interested in are listed below. Note that event classes and subclasses
are identified by an integer value when saved in SQL Server log tables;
we have given these integer values in parentheses after the events in
the list below and there is a script to insert all these IDs into SQL
Server tables available at http://tinyurl.com/SsasTraceIDs.
Command Begin (15) / Command End (16) contains only one interesting subclass event:
Progress Report Begin
(5) / Progress Report End (6) contains several subclass events that
apply to both processing and query operations. Below we list only the
subclass events relevant to processing:
Process (1)
ExecuteSQL (25)
WriteData (16)
ReadData (17)
BuildIndex (20)
BuildAggsAndIndexes (28)
It is important to note there is a sort of nesting of events that can be seen in trace data. For example, the Process event for a database initiates several other Process
events for related objects, such as the cubes and dimensions in that
database. The outermost events have an execution time (the column Duration,
in milliseconds) that includes the time taken for all the operations
executed within those events. Therefore, the values in the Duration
column for different events cannot easily be summed, because we have to
be careful not to sum events that might include each other. A good
approach is to filter rows by event class, event subclass and ObjectPath
(which uniquely identifies the object that the event refers to). For
example, if we want to find how long it took to process the Adventure
Works cube, we need to find the row in the trace that has the event
class Progress Report End, the event subclass 1 Process and the object path ServerName.Adventure Works DW 2008.Adventure Works.
ASTrace
Using SQL Server Profiler to
capture trace data is a good option if we want to create a trace
manually, but it is not the best way to automate trace data capture on a
production server. A useful tool is ASTrace, which is part of the
Microsoft SQL Server Community Samples for Analysis Services, available
fromhttp://sqlsrvanalysissrvcs.codeplex.com. ASTrace captures an Analysis Services trace and logs it into a SQL Server table.
This utility runs as a
Windows service that connects to Analysis Services, creates a trace and
logs trace events into a SQL Server table using the SQL Server Profiler
format. To customize the trace (for example, to filter on certain
events) we can use a standard trace template authored using SQL Server
Profiler. Running as a service, this tool does not require a logged in
user, unlike SQL Server Profiler.
XMLA
We can also initiate a trace by executing an XMLA command. The columns and events used in the trace are defined in the XMLA command itself. An example of an XMLA script is available here: http://tinyurl.com/XmlaTrace.
Flight Recorder
Flight Recorder is a feature
of Analysis Services that maintains a log of all events that happened
in the recent past that might be useful when investigating crashes or
performance problems; it works by running a trace. By default, it
doesn't capture all events and only keeps data for a limited time (so as
not to fill the disk with trace data), but we can customize it by
changing both the length of time it keeps data and the events that it
records. We have to remember, though, that Flight Recorder can affect
performance: the more events it records, the more I/O operations are
required to update the trace files it generates.
Flight Recorder trace files can be opened with SQL Server Profiler and are stored in the OLAP\Log folder (usually found at C:\Program Files\Microsoft SQL Server\MSSQL.2\OLAP\Log).
To customize the trace definition it uses we can use a SQL Profiler
template in the same way we did with ASTrace; a description of exactly
how to do this is available athttp://tinyurl.com/CustomizeFlightRecorder.
Flight Recorder and Trace Architecture
Monitoring Processing with Performance Monitor counters
Analysis Services has its own set of Performance Monitor
counters too. The most important ones for analyzing Analysis Services
processing operations can be found under the MSOLAP Processing category. Total Rows Converted, Total Rows Read, and Total Rows Written
are, respectively, the count of the number of rows converted, the count
of the number of rows read from all relational data sources, and the
count of the number of rows written during processing. These values
allow us to monitor the amount of data processed, and can be useful for
evaluating if the amount of time taken for processing is related to the
amount of data processed.
There is another set of performance counters relating to the Memory Manager. These counters are found in the MSOLAP Memory category:
Cleaner Memory non-shrinkable KB is the amount of memory that cannot be purged by the Memory Manager
Cleaner Memory shrinkable KB is the amount of memory that can be purged by the Memory Manager
Cleaner Memory KB
is the sum of the amount of shrinkable and non-shrinkable memory
returned by the two counters above, and this is the total amount of
memory controlled by the Memory Manager.
Memory Limit High KB returns the actual amount of memory that corresponds to the threshold set by the TotalMemoryLimit property.
Memory Limit Low KB returns the actual amount of memory that corresponds to the threshold set by the LowMemoryLimit property.
Memory Usage KB is the total of private virtual memory allocated by Analysis Services and corresponds to Process\PrivateBytes counter provided by the operating system. This number should be always greater than or equal to the CleanerMemoryKB. We should also look out for any paging caused by Analysis Services virtual memory.
As we previously said in the section Controlling the Analysis Services Memory Manager, it is important to compare the value of Cleaner Memory KB to the values of Memory Limit Low KB and Memory Limit High KB,
but also to look for any paging caused by Analysis Services virtual
memory. We might consider increasing our memory limits only if there is
no paging and there is enough physical RAM available. On the other hand,
we might want to decrease our memory limits if paging is having a
negative impact on performance (for example, if cache is paged to disk
it is much less efficient).
Monitoring Processing with Dynamic Management Views
Dynamic Management Views
(DMVs) were introduced in Analysis Services 2008 to track server
resources used, and can be queried using a SQL-like syntax. We can run a
DMV query in SQL Server Management Studio in an MDX query window. For
example, the following query shows the top 10 objects that used most
CPU:
SELECT TOP 10 *
FROM $System.DISCOVER_OBJECT_ACTIVITY
ORDER BY OBJECT_CPU_TIME_MS DESC
The result of this query
will display a large number of columns; the following table shows just
the first few columns from a sample Resultset:
|
OBJECT_PARENT_PATH
|
OBJECT_ID
|
OBJECT_CPU_TIME_MS
|
OBJECT_READS
|
OBJECT_READ_KB
|
|---|
|
HPVISTA\K8.Databases. Adv Works - DW.Dimensions
|
Date
|
62
|
1011
|
265
|
|
HPVISTA\K8.Databases. Adv Works - DW.Dimensions
|
Products
|
62
|
973
|
232
|
|
HPVISTA\K8.Databases. Adv Works -DW.Dimensions
|
Employee
|
46
|
747
|
278
|
DMV queries support only a subset of standard SQL. We can use WHERE conditions, DISTINCT and ORDER BY, but constructs like GROUP BY, JOIN, LIKE, CAST, and CONVERT are not supported. However, we can also project data using expressions and calling some functions, like Format.
Unfortunately, the documentation on DMVs is incomplete, although there is a lot of useful information on Vidas Matelis' blog athttp://tinyurl.com/vidasdmv, and on Darren Gosbell's blog athttp://tinyurl.com/darrendmv. We can return a list of schema rowsets that can be queried through DMVs by running the following query:
SELECT * FROM
$System.Discover_Schema_Rowsets
Despite the lack of
documentation, DMVs are very useful for monitoring Analysis Services.
When we want to monitor processing activity through DMVs, we probably
want to see what objects are consuming the most memory and CPU. Each
allocation in Analysis Services can be one of two types: shrinkable and
non-shrinkable. The shrinkable objects that consume the most memory can
be returned using a query like this:
SELECT *
FROM $System.DISCOVER_OBJECT_MEMORY_USAGE
ORDER BY OBJECT_MEMORY_SHRINKABLE DESC
Shrinkable objects can
be purged by Memory Manager if new allocations require memory. However,
it can also be useful to take a look at non-shrinkable objects because
they cannot be purged, and we might want to know what the most expensive
objects are. They will give us an indication of which databases should
be moved to another server to reduce resource consumption:
SELECT *
FROM $System.DISCOVER_OBJECT_MEMORY_USAGE
ORDER BY OBJECT_MEMORY_NONSHRINKABLE DESC
Much of the
information provided by DMVs is not available from other sources. For
this reason, it is important to know of their existence and to know how
to use them in our monitoring infrastructure.