Logo
programming4us
programming4us
programming4us
programming4us
Home
programming4us
XP
programming4us
Windows Vista
programming4us
Windows 7
programming4us
Windows Azure
programming4us
Windows Server
programming4us
Windows Phone
 
Windows Server

SharePoint 2010 PerformancePoint Services : Examining Excel Services Reports

- Free product key for windows 10
- Free Product Key for Microsoft office 365
- Malwarebytes Premium 3.7.1 Serial Keys (LifeTime) 2019
3/31/2011 4:53:35 PM
There are two ways to create an Excel Services report. You can select Other Reports from the Create tab in Dashboard Designer and then select Excel Services from the Report Template dialog box. Alternatively, you can right-click a PerformancePoint list in the Workspace Browser, select Report, and then select Excel Services from the dialog box.

There are two prerequisites for using an Excel Services report:

  • You must deploy an Excel spreadsheet to SharePoint.

  • You must have permissions to the location where you have deployed the spreadsheet.

As shown in Figure 1, you start with an Excel workbook deployed with the following deployment properties:
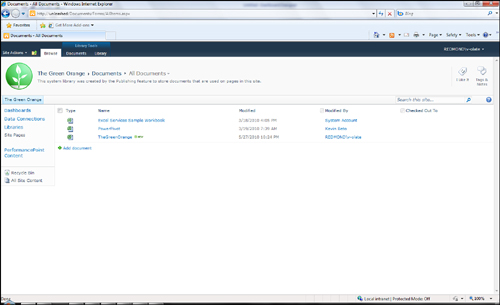
  • Server:http://unleashed

  • Document Library:Documents

  • Excel Workbook:TheGreenOrange.xlsx

Figure 1. This is an example of deployment properties for an Excel Services report.

To include this workbook into a dashboard, you need to create a new Excel Services report, as described earlier, and specify the deployment properties in the Report Settings, as shown in Figure 2.
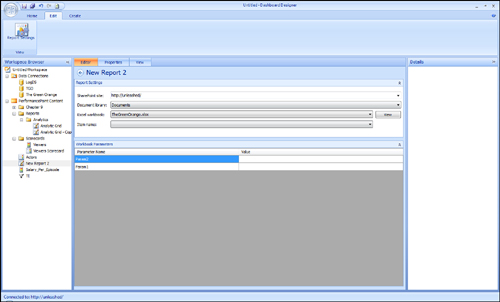
Figure 2. Specify the deployment properties in the Report Settings for your Excel Services report.

After the Excel Services report has been added to a dashboard, it will look like the report in Figure 3.
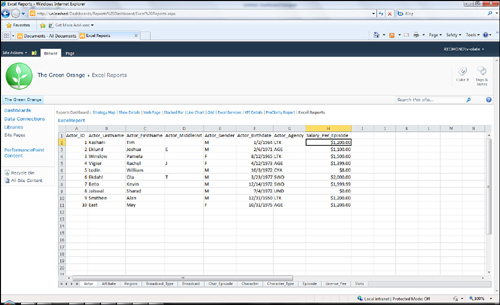
Figure 3. This is an example of an Excel Services report in a dashboard.

Note

Notice in Figure 3 that the entire workbook, including all the sheets, diagrams, and tables, is included. If you want to add only a specific item to the dashboard, you can specify the name of the item in the Excel Services Properties page (see Figure 4).
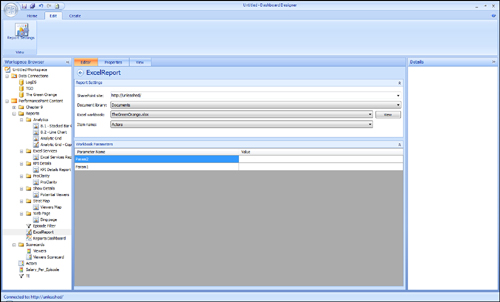
Figure 4. Use Item name on the Properties tab to show only a specific sheet, table, or chart.


After you add the report the dashboard, you only see the selected item, as shown in Figure 5.
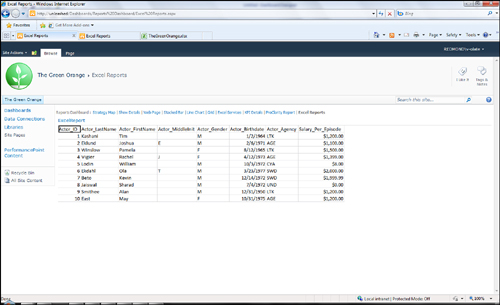
Figure 5. In this figure, the Excel Services report displays a single specified item.

If your workbook has one or more parameters defined, the names of these parameters appear in the Workbook Parameters section, and you can define default values (see Figure 6).
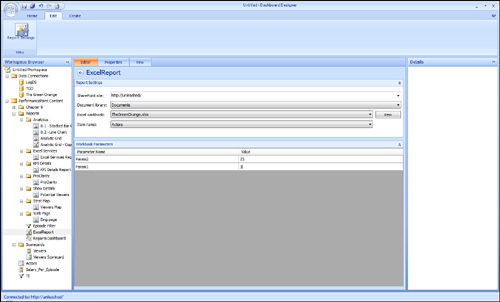
Figure 6. Define default values in the Workbook Parameters section.
Other -----------------
- SharePoint 2010 PerformancePoint Services : Examining Analytic Grid Reports
- SharePoint 2010 PerformancePoint Services : Examining Analytic Chart Reports
- Windows Server 2003 : Planning a Secure Baseline Installation - Identifying Client and Server Default Security Settings
- Windows Server 2003 : Planning a Secure Baseline Installation - Planning a Security Framework
- Windows Server 2003 : Planning a Secure Baseline Installation - Selecting Computers and Operating Systems
- BizTalk 2010 Recipes : Messaging and Pipelines - Configuring Port Maps
- BizTalk 2010 Recipes : Messaging and Pipelines - Configuring Send Ports
- BizTalk 2010 Recipes : Messaging and Pipelines - Configuring Receive Ports and Locations
- Windows Server 2008 Server Core : Managing Active Directory with the DSQuery Utility (part 3)
- Windows Server 2008 Server Core : Managing Active Directory with the DSQuery Utility (part 2)
 
 
Top 10
- Microsoft Visio 2013 : Adding Structure to Your Diagrams - Finding containers and lists in Visio (part 2) - Wireframes,Legends
- Microsoft Visio 2013 : Adding Structure to Your Diagrams - Finding containers and lists in Visio (part 1) - Swimlanes
- Microsoft Visio 2013 : Adding Structure to Your Diagrams - Formatting and sizing lists
- Microsoft Visio 2013 : Adding Structure to Your Diagrams - Adding shapes to lists
- Microsoft Visio 2013 : Adding Structure to Your Diagrams - Sizing containers
- Microsoft Access 2010 : Control Properties and Why to Use Them (part 3) - The Other Properties of a Control
- Microsoft Access 2010 : Control Properties and Why to Use Them (part 2) - The Data Properties of a Control
- Microsoft Access 2010 : Control Properties and Why to Use Them (part 1) - The Format Properties of a Control
- Microsoft Access 2010 : Form Properties and Why Should You Use Them - Working with the Properties Window
- Microsoft Visio 2013 : Using the Organization Chart Wizard with new data
 
programming4us
Windows Vista
programming4us
Windows 7
programming4us
Windows Azure
programming4us
Windows Server