Before you can successfully configure an Excel
Services data source, you need to have an Excel workbook deployed to a
SharePoint document library. Whether you are using an Unattended Service
Account or Per-User Identity, you also need to ensure that the identity
you are using to connect has the proper permissions to connect to the
SharePoint document library housing the Excel Services data source.
Note
If you are using an external
tabular or Analysis Services data source to populate the workbook,
remember that the connecting user must also have the proper permissions
to use the data source.
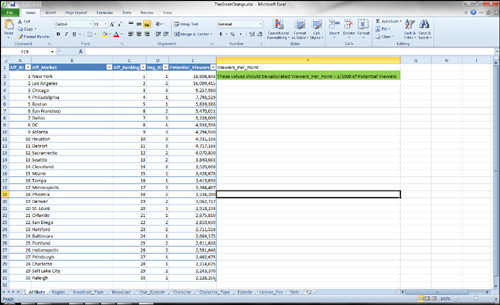
In this example, you are
going to connect to a spreadsheet called TheGreenOrange.xlsx that is
located in the Documents document library, as shown in Figure 1.
Create a New Excel Services Data Source
1. | You
create a new Excel Services the same way you created an Analysis
Services data source. Either click Data Source on the Create tab or
right-click Data Connections, and then select New Data Source.
|
2. | Next,
specify the SharePoint server and document library where the workbook
is located. After you have successfully connected to the document
library, you can enumerate all workbooks in that document library.
|
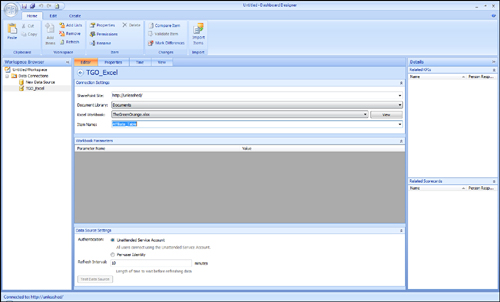
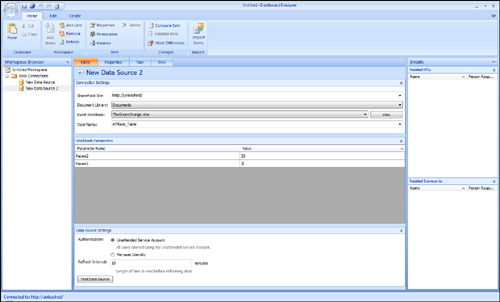
3. | This
step is important. You need to specify the name of a table or named
range within the workbook that you want to use. For this example, use a
table named Affiliate_Table. The complete settings look like those shown
in Figure 2.
|
4. | You
do this step with all tabular data source options, including Excel
Services, Import from Excel Workbook, SharePoint List, and SQL Server
Table. Because Dashboard Designer understands only dimensional data,
configure how to interpret the tabular columns as dimensions and facts
by clicking the View tab, as shown in Figure 3.
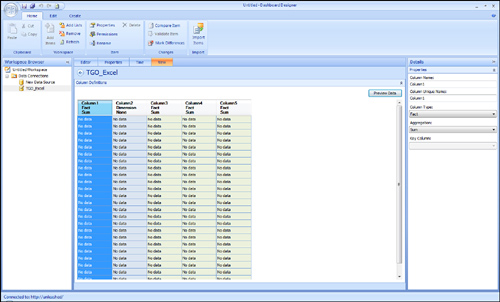
As you can see in Figure 6.5,
the five columns in the original workbook appear, and either a
dimension or a fact suggestion is provided based on the data type for
each column. Notice that all the cells say No data.
|
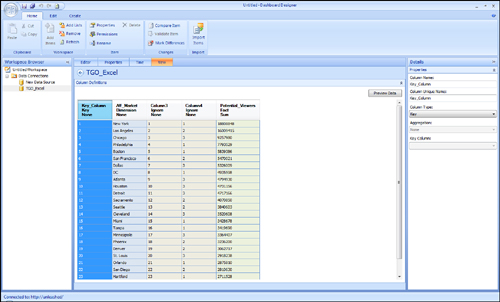
5. | Click
the Preview Data button to get a data sample based on the contents in
the workbook. The first 25 rows of data in the table appear.
|
6. | Dashboard
Designer will suggest that all numerical columns are facts and that all
text columns are dimensions. In this example you only want to use the
Aff_Market as a dimension and Potential_Viewers as a measure. You also
need to modify the column type and column headers to make them more
descriptive and useful. You can do this by changing the column type and
column headers in the Details Properties pane on the right side. Figure 4 shows what your data will look like after the column header names have been changed.
Note
In
addition to changing the column names, you can change a column type.
For example, there might be situations where Dashboard Designer suggests
that a column should be a fact when you actually want to use it as a
dimension. Table 1 lists the available column types you can specify.
Table 1. Tabular Data Source Column Types| Column Type | Function |
|---|
| Dimension | Values in this column are treated as if they were members of a dimension based on the column. | | Fact | Values in this column are treated as fact values. | | Ignore | Values in this column are ignored. | | Key | Values
in this column are treated as tuples. Data in the column has to be
formatted as a tuple, [Product].[Category].[Bike]. An example of using
this would be using filter values from a filter that is based on a
multidimensional data source. The values passed from the filter would
also be formatted as tuples. | | TimeDimension | Values in this column are candidates for mapping to the master time dimension for time intelligence. |
|
7. | Configure
the type of aggregation you want to use for your facts. The default is
always going to be Sum, but you can change the default by selecting a
different aggregation from the Aggregation drop-down list located in the
details pane. The types of aggregations are explained in Table 2.
Table 2. Aggregation Types| Aggregation | Usage |
|---|
| Average | Calculates the average of numeric fact values | | Count | Determines the number of occurrences of unique members in the column | | Minimum | Determines the smallest numeric fact value | | None | Performs no aggregation | | Statistical Standard Deviation | Calculates the standard deviation of numeric fact values | | Sum | Calculates the sum of the numeric fact values | | Statistical variance | Calculates the variance of the numeric fact values | | First occurrence | Determines the first fact value that occurs for each unique column member |
Tip
None, Count, and First
occurrences are the only aggregation types that can be used with textual
data. Using any other aggregation types will result in errors when
using the data source.
|
8. | Configure
the type of authentication model you want to use. The options are
Unattended Services Account or Per-user Identity. The settings for these
two options are the same as for the Analysis Services data source and
are found on the Editor tab.
|
9. | (Optional) The parameter configuration is optional because it applies only if the workbook has parameters defined (see Figure 5).
When you deploy a workbook to SharePoint, you have the option to
specify if you want to use a single-cell named range as a parameter.
These parameters can then be referenced in the parameters settings. Figure 6.7 shows an example of a different workbook with parameters called param1 and param2.
|
Tip
Parameters can be used
within an Excel workbook to pass some configuration data back to the
workbook. In the data source scenario, they are primarily used to modify
data when the parameters are used in formulas within the workbook.
However, they first need to be configured in the workbook in the Excel
Services Options dialog that is available when publishing the workbook
to Excel Services.
