Logo
programming4us
programming4us
programming4us
programming4us
Home
programming4us
XP
programming4us
Windows Vista
programming4us
Windows 7
programming4us
Windows Azure
programming4us
Windows Server
programming4us
Windows Phone
 
Windows Server

SharePoint 2010 PerformancePoint Services : Securing a PerformancePoint Installation - Per-User Identity

- Free product key for windows 10
- Free Product Key for Microsoft office 365
- Malwarebytes Premium 3.7.1 Serial Keys (LifeTime) 2019
5/3/2011 5:07:39 PM
The per-user identity option uses the user’s actual identity to connect to the data source. This allows the database developer to apply security at the data level. For example, users might be restricted to viewing information for their region and location only.

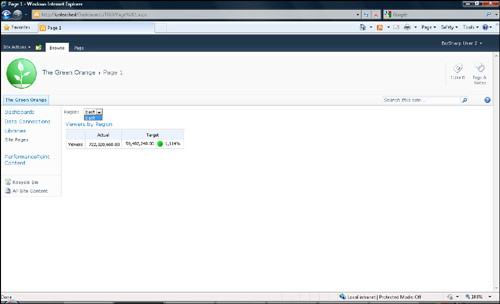
To illustrate, we work with a simple scorecard shown in Figure 1, which filters data based on regions.

Figure 1. This simple scorecard filters data based on regions and is used to demonstrate setting security with per-user identity.

The current security setting is the default: Connect Using Unattended Service Account. We want to change this default to apply security at the data level so that a user sees 
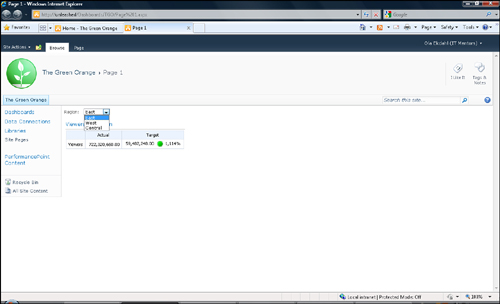
data for a particular region only. The first step is to change the data source authentication setting to per-user identity, as shown in Figure 2.

Figure 2. Start by changing the data source authentication setting to per-user identity.

The next step is to implement security on the data source. In this example, the data source is an Analysis Services cube, and we apply security using the SQL Server Management (SSMS) tool.

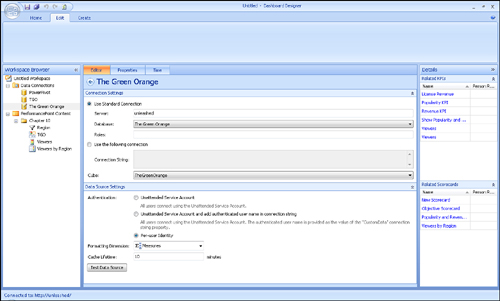
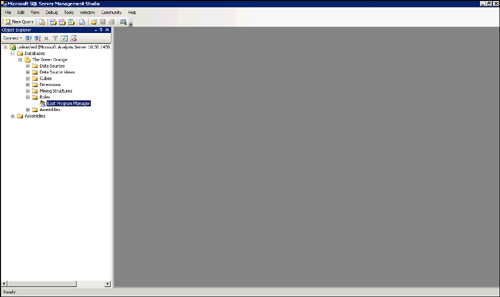
In SSMS, connect to the Analysis Services instance hosting the cube, expand the database, and open the Create Role dialog shown in Figure 3 by right-clicking the Roles folder. From here, select New Role.

Figure 3. You can apply security using SSMS.

In this example, we name the role East Program Manager. The goal is to add program managers from the East region to the role and configure security on this role so that users can see viewer numbers in that region only.

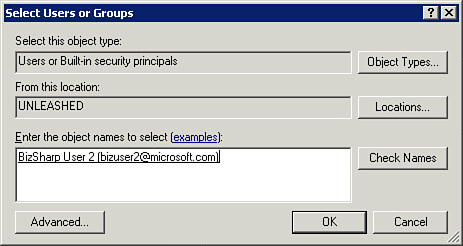
In the next step, click Membership and add users and or groups to this role, as shown in Figure 4. In this example, we add just one user: BizSharp User 2.

Figure 4. Use the Create Role dialog box to select users and groups.


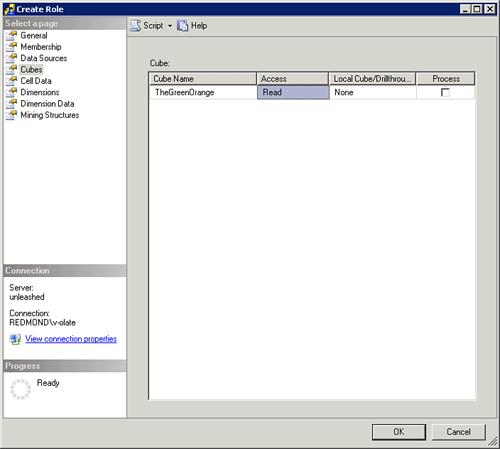
The next step is to grant read access to the cube. Click Cubes and select the cube, as shown in Figure 5.

Figure 5. Next, grant read access to the cube.

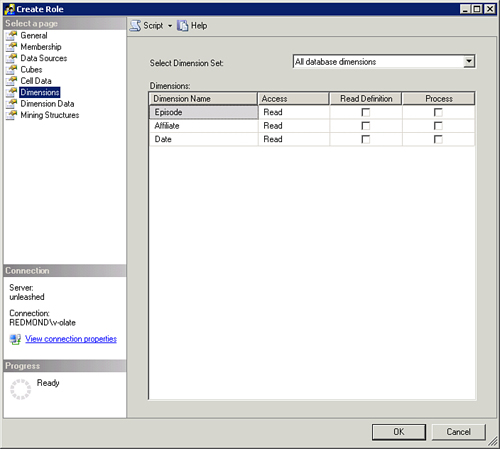
By default, we have read access to all dimensions shown in Figure 6, and we leave those settings as is.

Figure 6. By default, there is read access to all dimensions.

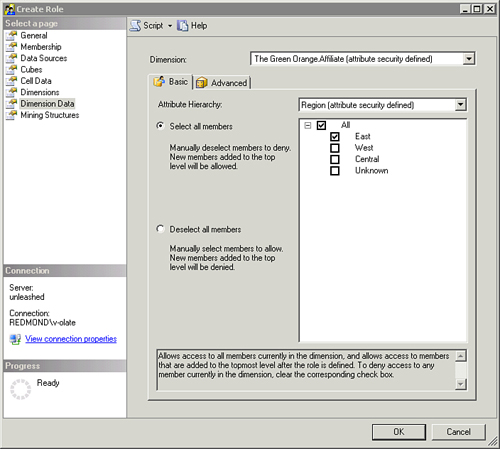
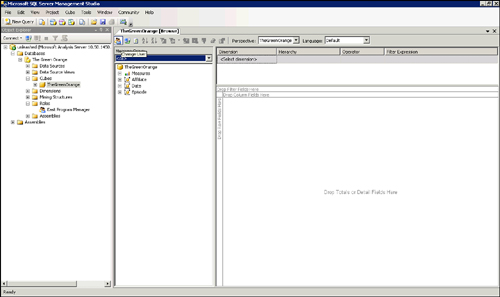
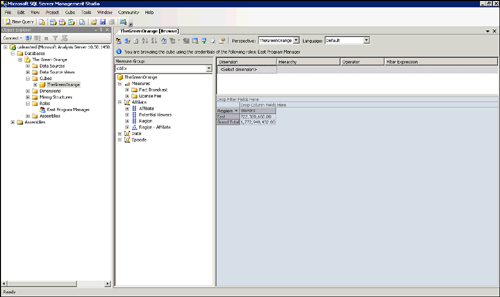
To configure the regions that can be used later on in a dashboard, we click Dimension Data and select the dimension and attribute hierarchy we want to secure. In this example, it is Affiliate and Region, as shown in Figure 7. We finish by removing the selection for all regions except for East, and then click OK to complete the security setup.

Figure 7. Select the members from this dialog box.

You now see the new role under the Roles folder, as shown in Figure 8.

Figure 8. You can see the new role under the Roles folder.

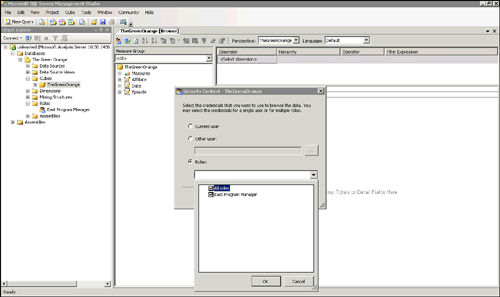
Before switching back to the dashboard to try the newly applied security, best practice is to verify that it has been applied correctly. Do this by browsing the cube in SSMS. Click the Change User button, as shown in Figure 9, to switch the role that is used.

Figure 9. Verify the newly applied security by switching the role that is used.


Doing so opens the Security Context dialog, from where we can change the role that we want to use, as shown in Figure 10.

Figure 10. From this screen, you can change the role you want to use.

In Figure 11, we can see that only the East region is visible when browsing the cube using the East Program Manager role.

Figure 11. Only the East region is visible when browsing the cube from the East Program Manager role.

We are now ready to try this from the dashboard. The only change that we need to make is to the authentication setting on the data source, as demonstrated earlier. Everything else remains the same.

In Figure 12, we can now see that when BizSharp User 2 logs on and views the same dashboard as you saw in Figure 1, only the East region is visible.

Figure 12. For this user, only the East region is visible from the dashboard.
Other -----------------
- BizTalk 2010 Recipes : Adapters - Creating Ports Through C Sharp Applications
- BizTalk 2010 Recipes : Adapters - Configuring SOAP Sends and Receives
- Windows Server 2008 R2 : Windows Media Services - Using Other Windows Media Encoder Options
- Windows Server 2008 R2 : Windows Media Services - Capturing Audio or Video for Future Playback
- BizTalk 2010 Recipes : Adapters - Configuring HTTP Receives
- BizTalk 2010 Recipes : Adapters - Configuring HTTP Sends
- Windows Server 2003 : Securing Network Communications Using IPSec - Troubleshooting Data Transmission Security
- Windows Server 2003 : Securing Network Communications Using IPSec - Deploying IPSec
- Transitioning from Exchange Server 2003 to Exchange Server 2010 (part 3) - Cleaning Up the Exchange Server 2003 and Exchange Server 2003 Environments
- Transitioning from Exchange Server 2003 to Exchange Server 2010 (part 2)
 
 
Top 10
- Microsoft Visio 2013 : Adding Structure to Your Diagrams - Finding containers and lists in Visio (part 2) - Wireframes,Legends
- Microsoft Visio 2013 : Adding Structure to Your Diagrams - Finding containers and lists in Visio (part 1) - Swimlanes
- Microsoft Visio 2013 : Adding Structure to Your Diagrams - Formatting and sizing lists
- Microsoft Visio 2013 : Adding Structure to Your Diagrams - Adding shapes to lists
- Microsoft Visio 2013 : Adding Structure to Your Diagrams - Sizing containers
- Microsoft Access 2010 : Control Properties and Why to Use Them (part 3) - The Other Properties of a Control
- Microsoft Access 2010 : Control Properties and Why to Use Them (part 2) - The Data Properties of a Control
- Microsoft Access 2010 : Control Properties and Why to Use Them (part 1) - The Format Properties of a Control
- Microsoft Access 2010 : Form Properties and Why Should You Use Them - Working with the Properties Window
- Microsoft Visio 2013 : Using the Organization Chart Wizard with new data
 
programming4us
Windows Vista
programming4us
Windows 7
programming4us
Windows Azure
programming4us
Windows Server