The ready-made reports Microsoft includes
with ConfigMgr provide extensive capabilities for reporting on your
environment and operations. However, you might sometimes need to
customize these reports to get just the right report to fit your
requirements. Here are several ways you can customize reports:
Change layout and display characteristics
of a report. For example, you can re-order the columns, add a chart or
modify the existing chart, or add or modify a link.
Change which data rows or columns are included in the report.
Add
data from additional Configuration Manager database tables or add data
ConfigMgr does not capture by default through inventory or discovery
customizations.
Add data from sources outside the Configuration Manager database.
The following sections present examples of each of these types of customization.
Note: Cloning Reports
For purposes of discussion, some examples in
this section modify the default Configuration Manager reports. In
reality, you generally want to clone the original report and make your
modifications to the cloned copy.
To clone a report, expand the Configuration
Manager console tree to System Center Configuration Manager -> Site
Database -> Computer Management -> Reporting -> Reports.
Right-click the report and choose Clone. You need to supply a new name
for the cloned report.
1. Customizing Report Layout and Display
To
customize the order the columns appear in a report, you can edit the
report’s SQL statement and simply re-order the items in the selection
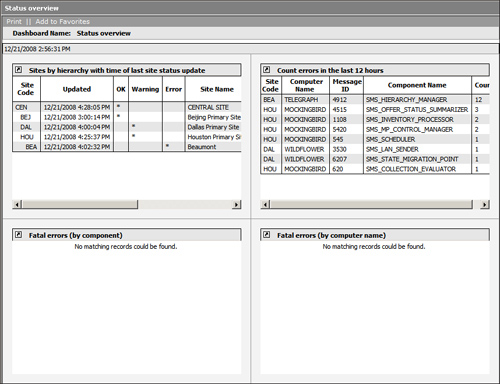
list. One of the reports used was Sites by hierarchy with time of last site status update.
This report provides a useful view of your sites, including their
hierarchical relationships and status. The most relevant data for the
status dashboard, however, is in the columns on the right of the report.
You cannot view the status information in the report in the upper-left
quadrant of the dashboard without scrolling to the right. To change the column order so that the
status information appears earlier in the report, perform the following
steps:
1. | Expand
the Configuration Manager console tree to System Center Configuration
Manager -> Site Database -> Computer Management -> Reporting
-> Reports. Right-click the Sites by hierarchy with time of last site status update report, and choose Properties.
|
2. | On
the Properties page for the report, select the General tab and click
the Edit SQL Statement button. A portion of the report’s SQL statement
is:
select SPACE(3*(SiteLevel-1))+so.SiteCode as SiteCode, s.SiteName,
s.ServerName,
  CASE s.Type WHEN 1 THEN '*' ELSE ' ' END as C085, s.ReportingSiteCode,
  s.Version, stat.Updated,
  CASE stat.Status WHEN 0 THEN '*' ELSE ' '  END As 'OK',
  CASE stat.Status WHEN 1 THEN '*' ELSE ' '  END As 'Warning',]
  CASE stat.Status WHEN 2 THEN '*' ELSE ' '  END As 'Error'
|
3. | Edit
the SQL Statement by moving the SiteName, ServerName, C085 (this is the
secondary site indicator), ReportingSiteCode, and version columns to
the end of the selection list. The resulting SQL statement will be:
select SPACE(3*(SiteLevel-1))+so.SiteCode as SiteCode, stat.Updated,
  CASE stat.Status WHEN 0 THEN '*' ELSE ' '  END As 'OK',
  CASE stat.Status WHEN 1 THEN '*' ELSE ' '  END As 'Warning',
  CASE stat.Status WHEN 2 THEN '*' ELSE ' '  END As 'Error', s.SiteName,
  s.ServerName,
  CASE s.Type WHEN 1 THEN '*' ELSE ' ' END as C085, s.ReportingSiteCode,
  s.Version
|
4. | Click
OK to close the Edit SQL Statement dialog box and again to close the
report Properties page. You can now run the report or the dashboard to
view the results of your changes. Figure 1 displays the Status Overview dashboard reflecting the report modifications.
|
You can also use the report Properties dialog
box to add a chart or link to an existing report or to modify an
existing chart or link. You can add a link to the Sites by hierarchy with time of last site status update report, which displays a map of your hierarchy as follows:
1. | Use
SMSMap to create the hierarchy map and save it as a graphical
interchange format (gif) file in a file system directory under your SMS
reporting folder. The reporting folder in this example is http://bluebonnet/SMSReporting_CEN. You can use
the Internet Information Service (IIS) Manager in the Administrative
Tools program group on Bluebonnet to view the properties of the
SMS_Reporting folder under the default website and see that the file
system path for the folder is c:\inetpub\wwwroot\SMSReporting_CEN. The
SMSMap is saved as
c:\inetpub\wwwroot\SMSReporting_CEN\images\SMSMap.gif. (See the Windows
Server help files for information about using IIS Manager.)
|
2. | Open
the report Properties by following step 1 of the previous procedure and
click on the report Properties page Links tab. Choose Link to URL from
the Link type drop-down list and enter http://bluebonnet/SMSReporting_CEN/images/smsmap.gif
in the URL box; then click OK to save your changes. The report now
displays a link icon next to each of the site codes, allowing you to
reference the site hierarchy map. |
