The Diagnostics page in Server Manager consolidates
three different consoles into a convenient location. The three consoles
are as follows:
Event Viewer
Performance
Device Manager
The next sections review the
various features of the three consoles on the Diagnostics page.
Event Viewer
The Windows Server 2008 R2
Event Viewer functionality has been improved over the Windows Server
2003 version. The version in Windows Server 2008 R2 is the version that
released in Windows Vista. The event logs can contain an overwhelming
volume of information, which the new Event Viewer summarizes and drills
into very effectively.
Selecting the Event Viewer
folder under Diagnostics shows the Overview and Summary page. The
Summary of Administrative Events section on this page shows a high-level
summary of the administrative events, organized by level:
Critical
Error
Warning
Information
Audit Success
Audit
Failure
The view shows the total
number of events in the last hour, 24 hours, 7 days, and the total. Each
of these nodes can be expanded to show the counts of particular event
IDs within each level. Double-clicking on the event ID count shows a
detailed list of the events with the matching event ID. This is very
useful for drilling on the specific events to see when they are
occurring.
The Overview and Summary
page also has a Log Summary section, which shows a list of all the
various logs on the server. This is important, as there are now over 100
different logs in Windows Server 2008 R2. In addition to the standard
system, security, and application logs, there is a setup log and a
forwarded events log. Then there are the numerous application and
services logs, which include logs for each application, service, and a
huge number of diagnostic and debugging logs. For each of the logs, the
Log Summary section shows the log name, current size, maximum size, last
modification, if it is enabled, and what the retention policy for the
log is. This allows the administrator to quickly see the status of all
the logs, which would be a daunting task otherwise.
Of course, the logs can be
viewed directly by expanding the Windows Logs folder or the Applications
and Services Logs folder. The Windows Logs folder contains all the
standard application, security, setup, system, and forwarded events
logs. The applications and services logs contain all the other ones.
Custom views can be created
to filter events and combine logs into a coherent view. There is a
default Administrative Events view, which combines the critical, error,
and warning events from all the administrative logs. There is also a
custom view created for each role that is installed on the server. New
ones can be created by the administrator as needed.
Subscriptions can collect
events from remote computers and store them in the forwarded events log.
The events to be collected are specified in the subscription. The
functionality depends on the Windows Remote Management (WinRM) and the
Windows Event Collector (Wecsvc) services, and they must be running on
both the collecting and forwarding servers.
Server Manager
Performance Monitor
The Performance monitor is
incorporated into Server Manager as well. This diagnostic tool enables
the administrator to monitor the performance of the server in real time,
generate reports, and also save the performance data to logs for
analysis.
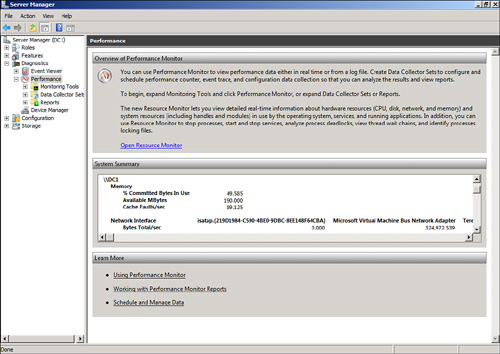
The top-level folder of the
Performance Monitor displays the System Summary. This gives a
comprehensive overview of the memory, network interface, physical disk,
and processor utilization during the past 60 seconds (shown in Figure 1). The System Summary is organized in a matrix,
with a column for each instance of the network interface, disk, and
processor. The information is updated every second. Unfortunately, the
pane is a fixed height, so it is hard to see all the information at
once, and excessive scrolling is needed.
The Monitoring Tools
contains the Performance Monitor tool. This tool allows you to monitor
the performance of the server in more detail. The Performance Monitor
has not really changed from previous versions of Windows. It allows you
to select performance counters and add them to a graph view for
real-time monitoring. The graph can be configured to be a line graph, a
bar graph, or even a simple text report of the counters being monitored.
The monitor shows the last, average, minimum, maximum, and duration of
the windows (1 minute 40 seconds by default).
For longer-term tracking, the
Data Collector Sets can be used. Data Collector Sets can log data from
the following data sources:
Performance counters
Event traces
Registry key
values
This data can be logged over
an extended period of time and then reviewed. The data collected will
also be analyzed and presented in reports that are very useful. There
are two reports defined by default, the System Diagnostics and System
Performance. When roles are added, such as the Active Directory Domain
Services role, there might be additional Data Collector Sets defined.
These data sets gather data that is presented in reports, which is new
to Windows Server 2008 R2. There is a new reports folder in the
Performance Monitor where the reports are saved.
To generate data for a
Performance Monitor report, execute the following steps:
1. | Launch
Server Manager.
|
2. | Expand
the Diagnostics node.
|
3. | Expand the Performance node.
|
4. | Expand the Data Collector Sets node.
|
5. | Expand the System node and select the System
Performance Data Collector Set. Note that the Data Collector Set
includes an NT Kernel trace and performance counters.
|
6. | Right-click on the NT Kernel trace object and select
Properties. Note the events that will be collected. Click Cancel to exit
without saving.
|
7. | Right-click
on the Performance Counter object and select Properties. Note the
performance counters that will be collected. Click Cancel to exit
without saving.
|
8. | Right-click
on the System Performance Data Collector Set and select Start. The Data
Collector Set will start collecting data.
|
9. | Right-click on the System Performance Data Collector
Set and select Latest Report.
|
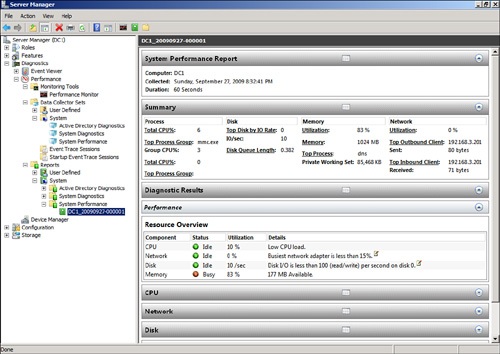
The report will show a detailed
analysis of the system performance. The Summary and the Diagnostic
Results are shown in Figure 2. The Diagnostic Results indicate that memory is the busy
component on the DC1 server. The report contains a wealth of details on
the CPU, Network, Disk, Memory, and overall report statistics.
You can also view the
performance data that the report is based on directly. This can be done
by right-clicking the specific report and selecting View, Performance
Monitor. This shows the graph of all the counters selected during the
data collection. You can select which counters to show in the graph.
The System Performance Data Collector Set only
collects for 1 minute, which is not long enough for detailed trend
analysis. New Data Collector Sets can be defined in the User Defined
folder. For example, to create a duplicate of the System Performance
Data Collector Set that will run for an hour instead of a minute, do the
following:
1. | Launch
Server Manager.
|
2. | Expand
the Diagnostics node.
|
3. | Expand the Performance node.
|
4. | Expand the Data Collector Sets node.
|
5. | Select the User Defined node.
|
6. | Right-click on the User Defined node and select New,
Data Collector Set.
|
7. | Enter System Performance 1 Hour for the name
and make sure that the Create from a Template is selected. Click Next.
|
8. | Select System Performance and Click Next.
|
9. | Click Next to keep the default root directory.
|
10. | Select the Open properties for this Data Collector Set
and click Finish.
|
11. | Click on
the Stop Condition tab.
|
12. | Change the Overall Duration setting to 1 hour.
|
13. | Click OK to save.
|
This Data Collector Set can now
be run and will collect the same data as the default System
Performance, but for 1 hour instead of just 1 minute.
Device Manager
The Device Manager node shows
the hardware that is installed on the server. It shows the hardware
grouped by type of device, such as Disk Drives, Display Adapters, and
Network Adapters. Each instance of the device type is listed in a node
underneath the device type.
The Device Manager can be used
to update the device drivers of the hardware, to change settings, and to
troubleshoot issues with the hardware. Specifically, you can perform
the following tasks:
Scan for new hardware
Identify hardware problems
Adjust configurations
View
device driver versions
Update the device
drivers
Roll back device driver upgrades
Enable or disable hardware
For example, sometimes
older video drivers or network card drivers will cause problems with the
system. It is easy to check the Microsoft online driver repository
using Device Manager. To check for an
update to the device driver for the network adapter, follow these steps:
1. | Expand
the Network Adapters node in Device Manager.
|
2. | Select the network adapter to check.
|
3. | Select Action, Update Driver Software from the menu.
|
4. | Click on Search Automatically for Updated Driver
Software.
|
5. | Click on
Yes, Always Search Online (Recommended).
|
6. | Install the update if found.
|
7. | Click Close to exit the wizard.
|
Note
Many times, the latest
version of the driver will already be installed. In these cases, the
message “The best driver for your device is already installed” will be
shown.
