Although single page
tracing is useful (especially for quick spot checks for problems), it
has a major downside in that it litters the page with lots of garbage at
the end. You can use application tracing to get around that. Application tracing shows you exactly the same details as page
tracing, except they're held in memory and made available rendered as a
different page and through a special HTTP handler that ASP.NET
provides.
To turn on tracing, you need to enable tracing in web.config like so:
<configuration>
  <system.web>
    <trace enabled="true"/>
  </system.web>
</configuration>
This simply turns on tracing. You can actually control several aspects of page
tracing. For example, you could have tracing available on the host
computer only (in case you don't want clients getting to your trace information). You might also want to control the number of responses that are held in memory.
Table 1 shows the possible values that can go in the configuration file to support tracing.
Table 1. Web.config Settings Supporting Tracing
| Key | Possible Values | Meaning |
|---|
| Enabled | true
false | Enable or disable application-level tracing. |
| localOnly | true
false | Specify whether to show trace output only on local host or everywhere. |
| mostRecent | true
false | Specify whether to recycle traces once requestLimit is met or to keep the first N (up to the requestLimit threshold). |
| pageOutput | true
false | Specify whether to display trace output on individual pages in addition to caching application-level traces. |
| requestLimit | Decimal number | Specify how many traces to store in memory before removing earlier traces (default is 10). |
| traceMode | SortByTimeSortByCategory
| Specify the order in which to display trace information. |
| writeToDiagnosticsTrace | true
false | Specify whether the trace data is also piped to System.Diagnostics.Trace. |
The following exercise demonstrates how application-level tracing works and how to navigate around the results.
Using application-level tracing
Open the DebugORama project. Open the TraceMe.aspx page. Turn off tracing in the page by ensuring the Page class's Trace property is set to false.
Ensure that application-level tracing is turned on in web.config. That is, open web.config and add a trace
element, as shown earlier. If the application doesn't yet have a
configuration file, you can add one by selecting Add New Item from the
local project menu.
Surf to the TraceMe.aspx page a few times by pressing Ctrl+F5, and then adding a few strings to the table.
In the URL that appears in the address box, make the endpoint Trace.axd,
as shown in the following graphic. This name in the URL redirects
request processing through a special handler that renders the tracing
results being kept in memory.
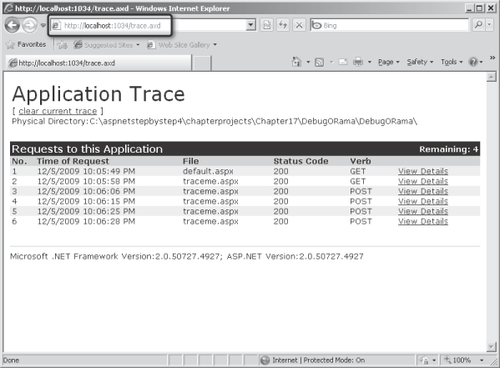
You
should be able to see a list of requests. You can see individual
requests and the request details, as shown in the following graphic, by
clicking the View Details link.
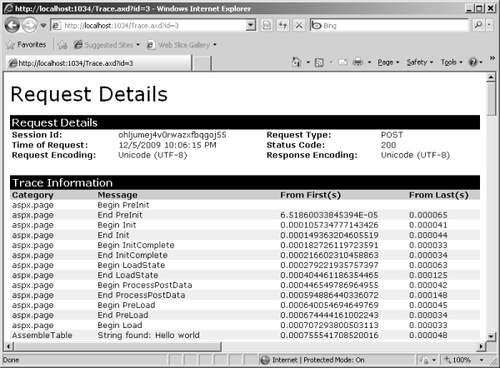
Notice how the output is exactly the same as the output of the earlier page tracing example. However, now the tracing information stands alone without cluttering up the Web page.
1. Enabling Tracing Programmatically
Although much of the
time you will enable tracing through the Designer, at times you might
find it useful to manage tracing during run time (programmatically). For
example, you might have regular clients receive normal content;
however, when someone with specific credentials appears, you might want
to enable tracing for that individual. You might also decide to modify
tracing when a certain parameter comes through the request.
The DebugORama site
includes a page named EnableTracing.aspx that illustrates how to control
the tracing programmatically. If the user types the correct password,
the tracing is turned on. The page also shows how to enable and disable
tracing programmatically.
public partial class EnableTracing : System.Web.UI.Page
{
   protected void Page_Load(object sender, EventArgs e)
   {
   }
   protected void Button1_Click(object sender, EventArgs e)
   {


      if (this.TextBoxSecretCode.Text == "password")
      {
         this.Trace.IsEnabled = true;
      }
   }
   protected void Button2_Click(object sender, EventArgs e)
   {
      this.Trace.IsEnabled = false;
   }
}
2. The TraceFinished Event
The tracing context includes an interesting event named TraceFinished that gives you a last chance opportunity to log the tracing information or deal with it in some other way. The TraceFinished event is raised by the Trace object after all request information is gathered.
To subscribe to the event, simply set up the handler during the Page_Load
event. The DebugORama example includes a page named TraceFinished.aspx
that shows how the trace information was gathered and written to the
debug console using System.Diagnostics.Debug.
public partial class TraceFinished : System.Web.UI.Page
{
    protected void Page_Load(object sender, EventArgs e)
    {
      Trace.TraceFinished +=
         new TraceContextEventHandler(TracingFinished);
    }

    void TracingFinished(object sender, TraceContextEventArgs e)
    {
      foreach (TraceContextRecord traceContextRecord in e.TraceRecords)
      {
         System.Diagnostics.Debug.WriteLine(traceContextRecord.Message);
      }
    }
}
3. Piping Other Trace Messages
In the last example, tracing messages were logged manually to the debug console by setting up the TraceFinished event handler in the Trace context. System.Diagnostics.Debug is a standard .NET type that's helpful for managing tracing and debugging information. Since version 2.0, ASP.NET has had the ability to plug in the WebPageTraceListener type so that calls to System.Diagnostics.Trace are also inserted into the ASP.NET trace. Setting it up is simply a matter of inserting a line in web.config (note the writeToDiagnosticsTrace option in Table 1). A case in which this is useful is for logging compiler output. To do this, set the writeToDiagnosticsTrace option to true, and then turn on compiler tracing. Compiler tracing is another setting you can set in web.config, but notice that this lies outside the typical System.web section of web.config.
<system.codedom>
    <compilers>
        <compiler compilerOptions="/d:TRACE" />
    </compilers>
</system.codedom>
