6. Netstat
For a network service to
receive incoming communications, it must listen for communications on a
specific TCP or UDP port. When troubleshooting network problems, you
might want to view the ports on which your computer listens for incoming
connections to verify that a service is properly configured and that
the port number has not changed from the default.
Netstat (Netstat.exe) is a
useful command-line tool for identifying network services and the ports
they listen on. Listing the ports a computer listens on is useful for
verifying that a network service is using the expected port. It is
common practice to change the port numbers that services listen on, and
Netstat can quickly identify nonstandard listening ports.
To view open ports and active incoming connections, open a command prompt and run the following command.
netstat -a -n -o
Netstat will display a list of listening ports as well as outgoing connections and the Process
Identifiers (PIDs) associated with each listener or connection. The
following edited output from Netstat shows the listening ports on a
computer running Windows that has Remote Desktop enabled.
Active Connections

  Proto  Local Address          Foreign Address        State           PID
  TCP    0.0.0.0:135            0.0.0.0:0              LISTENING       884
  TCP    0.0.0.0:3389           0.0.0.0:0              LISTENING       1512
  TCP    0.0.0.0:49152          0.0.0.0:0              LISTENING       592
  TCP    192.168.1.132:139      0.0.0.0:0              LISTENING       4
  TCP    192.168.1.132:3389     192.168.1.196:1732     ESTABLISHED     1512
  TCP    [::]:135               [::]:0                 LISTENING       884
  TCP    [::]:445               [::]:0                 LISTENING       4
  TCP    [::]:2869              [::]:0                 LISTENING       4
  TCP    [::]:3389              [::]:0                 LISTENING       1512
  UDP    [fe80::28db:d21:3f57:fe7b%11]:1900  *:*                       1360
  UDP    [fe80::28db:d21:3f57:fe7b%11]:49643  *:*                      1360
  UDP    [fe80::a54b:d9d7:1a10:c1eb%10]:1900  *:*                      1360
  UDP    [fe80::a54b:d9d7:1a10:c1eb%10]:49641  *:*                     1360
Notice that the line in bold is
listening for incoming connections on TCP port 3389, which Remote
Desktop uses. Because the Foreign Address column shows an IPv4 address,
you can tell that a user is connected to the computer using Remote
Desktop from a computer with the IP address of 192.168.1.196. If you
notice that a computer is listening for incoming connections on
unexpected ports, you can use the value in the PID column to identify
the process. Tools such as the Processes tab in Task Manager can reveal
which process is associated with a PID.
Note:
To identify processes by PID
in Task Manager, select the Processes tab. On the View menu, click
Select Columns. Select the PID (Process Identifier) check box and then
click OK.
Alternatively, if you can open a command prompt with elevated privileges, you can use the –b parameter to resolve applications associated with active connections. The following example demonstrates that using the –b parameter shows the associated process in brackets before each connection.
netstat -a -n -o -b

Active Connections

  Proto  Local Address          Foreign Address        State           PID
  TCP    0.0.0.0:135            0.0.0.0:0              LISTENING       828
  RpcSs
 [svchost.exe]
  TCP    0.0.0.0:3389           0.0.0.0:0              LISTENING       1444
  Dnscache
 [svchost.exe]
  TCP    0.0.0.0:49152          0.0.0.0:0              LISTENING       508
 [wininit.exe]
  TCP    0.0.0.0:49153          0.0.0.0:0              LISTENING       972
  Eventlog
 [svchost.exe]
  TCP    0.0.0.0:49154          0.0.0.0:0              LISTENING       1236
  nsi
 [svchost.exe]
  TCP    0.0.0.0:49155          0.0.0.0:0              LISTENING       1076
  Schedule
 [svchost.exe]
  TCP    0.0.0.0:49156          0.0.0.0:0              LISTENING       564
 [lsass.exe]
  TCP    0.0.0.0:49157          0.0.0.0:0              LISTENING       552
 [services.exe]
  TCP    169.254.166.248:139    0.0.0.0:0              LISTENING       4
TCPView,
a free download from Microsoft, provides similar functionality with a
graphical interface.
7. Network Monitor
Network Monitor 3.3, a free download from http://www.microsoft.com/downloads/,
is the most capable—and complicated—tool for analyzing network
communications. Network Monitor is a protocol analyzer (commonly known
as a sniffer)
capable of capturing every byte transferred to and from a computer
running Windows 7. An experienced system administrator can use Network
Monitor to troubleshoot a wide variety of problems, including:
Network performance problems.
TCP connection problems.
IP protocol stack configuration problems.
Problems caused by network filtering.
Application-layer
problems with text-based protocols, including Hypertext Transfer
Protocol (HTTP), Post Office Protocol (POP), and Simple Mail Transfer
Protocol (SMTP).
Network
Monitor performs a significant amount of interpretation of captured
information by separating the different protocols involved in network
communications. Network
Monitor can even interpret most common application-layer protocols. For
example, when analyzing HTTP traffic, Network Monitor automatically
identifies the packet containing the HTTP request and lists the request
method, Uniform Resource Locator (URL), referrer, user agent, and other
parameters included in the request. This information is extremely useful
when troubleshooting compatibility problems with a specific browser.
To analyze network traffic by using Network Monitor, follow these steps:
Download
and install Network Monitor and then restart the computer to enable the
Network Monitor driver for your network adapters.
Click Start, click All Programs, click Microsoft Network Monitor 3.3, and then click Microsoft Network Monitor 3.3.
With the New Capture tab selected, click the Select Networks tab and select one or more network adapters.
Click Start to begin capturing communications.
Switch
to the application from which you want to capture the network traffic
and then perform the steps to generate the traffic. For example, if you
want to capture a request to a Web server, switch to Windows Internet
Explorer and enter the Web address. After you have generated the traffic
that you want to capture, return to Network Monitor.
On the Capture menu in Network Monitor, click Stop.
On the Network Conversations page, click the application you want to monitor.
In the Frame Summary pane, browse the captured frames. Click a frame to view its contents.
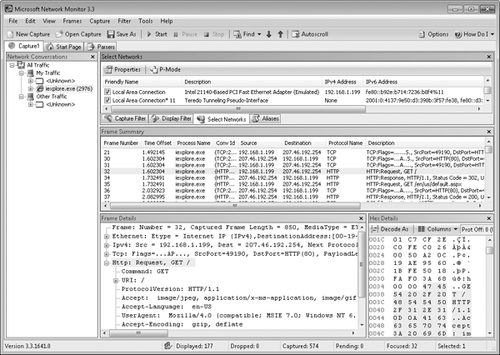
Figure 1
shows a capture of a TCP connection and an HTTP request created by
visiting a Web site with a browser. Because Iexplore.exe is selected in
the Network Conversations pane, only frames sent to or from Internet
Explorer are displayed. The Frame Summary pane lists the captured
packets. The first three frames show the three-way TCP handshake. As you
can see from the Frame Details pane, the selected frame shows Internet
Explorer requesting / from the Web server. The following frame is the
response, which is an HTTP 302 redirection to a different page. Frame 35
is Internet Explorer requesting the page to which it was directed, /en/us/default.aspx.