2. Diagnostic host configuration
You can change the
configuration for the agent with code that’s running in the role that’s
collecting data, code that’s in another role, or code that’s running
outside Azure (perhaps a management station in your data center).
Changing the Configuration in a Role
There will be times when you
want to change the configuration of the diagnostic agent from within the
role the agent is running in. You’ll most likely want to do this during
an OnStart event, while an instance for
your role is starting up. You can change the configuration at any time,
but you’ll probably want to change it during startup. The following listing shows how to change the configuration during the OnStart method for the role instance.
Listing 1. Changing the configuration in a role at runtime
The first step to change the configuration is to grab the default configuration  from the diagnostic agent manager. This is a static method and it gives
you a common baseline to start building up the configuration you want
running.
from the diagnostic agent manager. This is a static method and it gives
you a common baseline to start building up the configuration you want
running.
In our sample, we’re adding a performance counter called \Memory\Available MBytes  . The CounterSpecifier
property is the path to the performance counter. You can easily find
performance counter paths if you use the Performance Monitor, as shown
in figure 3.
. The CounterSpecifier
property is the path to the performance counter. You can easily find
performance counter paths if you use the Performance Monitor, as shown
in figure 3.
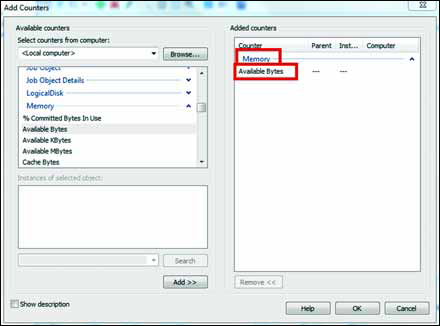
Browse to the counter you
want to track to find the specifier (which is like a file path) in the
corner. Tell the agent to sample that performance counter every second  , using the PerformanceCounterConfiguration
class. Each data source the agent has access to has a configuration
class. For each piece of data you want collected, you need to create the
right type of configuration object, and add it to the matching
configuration collection, which in this case is the PerformanceCounterConfiguration collection.
, using the PerformanceCounterConfiguration
class. Each data source the agent has access to has a configuration
class. For each piece of data you want collected, you need to create the
right type of configuration object, and add it to the matching
configuration collection, which in this case is the PerformanceCounterConfiguration collection.
You also want to
aggressively upload the performance counter data to Azure storage.
Usually this value is set to 20 minutes or longer, but in this case you
probably don’t want to wait 20 minutes to see whether we’re telling you
the truth, so set it to once a minute  .
Each data source will have its own data sources collection and its own
transfer configuration. You’ll be able to transfer different data
sources at different intervals. For example, you could transfer the IIS
logs once a day, and transfer the performance counters every 5 minutes.
.
Each data source will have its own data sources collection and its own
transfer configuration. You’ll be able to transfer different data
sources at different intervals. For example, you could transfer the IIS
logs once a day, and transfer the performance counters every 5 minutes.
Finally,
start the diagnostic agent. You need to provide it with the connection
string to the storage account that you want the data uploaded to, and
the configuration object you just built. The connection string defaults
to the value DiagnosticsConnectionString,
which is an entry in the cloud service configuration file. When you’re
playing with this on your development machine, you set the value to UseDevelopmentStorage=true, but in production you set it to be a connection string to your storage account in the cloud.
The data will be uploaded
to different destinations, depending on the data source. In the case of
performance counters, the data will be uploaded to an Azure table called
WADPerformanceCountersTable, an example of which is shown in figure 4.
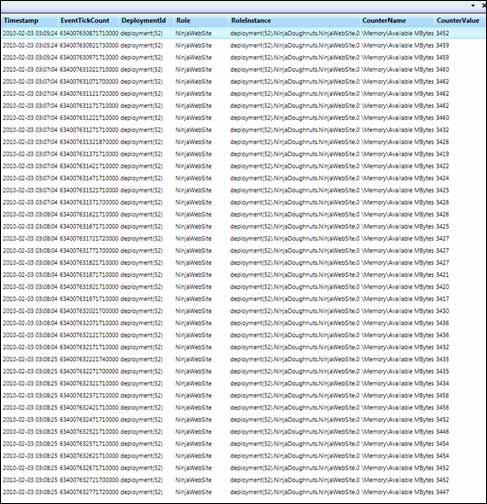
Figure 4
shows the results of the performance counter configuration. The agent
tracked the available memory every 5 seconds, and stored that in the
table. The entries were uploaded from the role instance to the table
every minute, based on the configuration. The high order of the tick
count is used as a partition key so that querying by time, which is the
most likely dimension to be queried on, is fast and easy.
The RoleInstance column
contains the name of the instance, to differentiate entries across the
different role instances. In this case, there’s only one instance.
Tracking log data can generate a lot of data. To make all this data easier to use, the diagnostic agent supports filters.
Filtering the Uploaded Data
The
amount of data collected by the diagnostic agent can become voluminous.
Sometimes you might want to track a great deal of data, but when you’re
trying to solve a particular problem, you might want only a subset of
data to look through. The diagnostic agent configuration provides for
filtering of the results.
The agent still collects all
the data locally. The filter is applied only when the data is uploaded
to Azure storage. Filtering can narrow down the data you need to sift
through, make your transfers faster, and reduce your storage cost. You
can set the following property to filter based on the log level of the
records that you’ve specified:
transferOptions.LogLevelFilter = LogLevel.Error;
All the log data remains local to the agent; the agent uploads only the entries that match or exceed the filter level you set.
Changing the Configuration from Outside the Role
Being able to change the
configuration inside the role instance is nice, but you’ll probably do
this only during the startup of the instance. Dynamic changes to the
configuration are more likely to come from outside the role instance.
The source of these changes will probably be either an overseer role
that’s monitoring the first role, or a management application of sorts
that’s running on your desktop.
The agent’s configuration is
stored in a file local to the role instance that’s running the agent. By
default, this file is polled every minute for any configuration
changes. You can change the polling interval if you want to by using the
DiagnosticMonitorConfiguration.ConfigurationChangePollInterval property. You can set this property only from within the role the agent is running in.
To update the configuration remotely, either from another role or from outside Azure, you can use two classes. The DeploymentDiagnosticManager
class is a factory that returns diagnostic managers for any role you
have access to. You can use this manager to change the configuration
remotely by using it to create RoleInstanceDiagnosticManager objects. Each RoleInstanceDiagnosticManager object represents a collection of diagnostic agents for a given role, one for each instance running in that role.
After you’ve created this
object, you can make changes to the configuration like you did in the
previous section. The trick is that you have to change the configuration
for each instance individually. The following listing shows how to
update the configuration for a running role.
Listing 2. Remotely changing the configuration of a role’s diagnostic agent
The first thing you do to update the configuration for a running role is get an instance of the DeploymentDiagnosticManager
for the deployment. One object oversees all the roles in your
deployment. Give it a connection string to your storage account for
logging. This constructor doesn’t take a configuration element like the DiagnosticsMonitor class does. You have to pass in a real connection string, or a real connection. The code in listing 18.2 grabs the string out of the role configuration with a call to GetConfigurationSettingValue.
From there, you ask for a collection of RoleInstanceDiagnosticManager objects for the particular role you want to work with. In this example, we’re changing the configuration for the NinjaWebSite role. You’ll get one RoleInstanceDiagnosticManager object for each instance that’s running the NinjaWebSite role.
Next, you create the new part of the configuration you want to add to the agent .
In this example, you’ll build another performance counter data source
that will track the percentage of CPU in use. Then you’ll iterate over
your collection and add the new performance counter CPUTime to the current configuration .
This process is different from that used when you’re changing the
configuration in a role. Here you want to add to the configuration, not
completely replace it. Finally, you update the configuration for that
instance, which updates the configuration file for the diagnostic agent.
When the agent polls for a configuration change, it’ll pick up the
changes and recycle to load them.
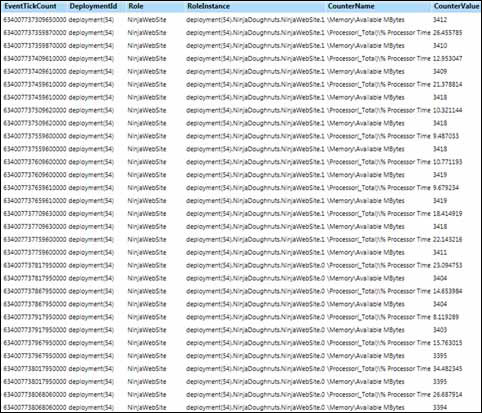
Figure 5 shows the results of the configuration changes that you’ve made.
In this sample, we’ve put
this code in the role, but this code would work running from any
application that’s running outside Azure as well. The only difference
would be how you provide the connection string to storage, and how you
provide the deployment ID.
We’ve looked at the
standard data sources for Windows Azure diagnostics, but there’s one
hole remaining. What if you want to manage a diagnostic source that
isn’t on the official list? This situation is where the escape hatch
called arbitrary diagnostics sources comes into play.
