The diagnostic agent does a great job of collecting
all the local data and storing it on the machine it’s running on. But if
the diagnostic information is never moved to Azure storage, it won’t be
any good to anyone. This is where transfers come into play.
There are two types of
transfers, one of which you have already seen in play. We’ve already
talked about the scheduled transfer, which sets up a timer and transfers
the related data on a regular basis to your storage account. Each data
source category has its own transfer schedule. You can transfer
performance counter data at a different rate than you transfer the IIS
logs.
The second type of transfer
is an on-demand transfer. You usually perform an on-demand transfer
when you have a special request of the data.
Let’s look at each of these
kinds of data transfers in more detail.
1. Scheduled
transfer
In our sample in listing 1 of this article, a scheduled transfer of the
performance counter data is set  to
occur every minute. As we covered earlier, transferring every minute is
quite aggressive, and is probably reasonable only in a testing or
debugging environment.
to
occur every minute. As we covered earlier, transferring every minute is
quite aggressive, and is probably reasonable only in a testing or
debugging environment.
In our next example, we’re
going to show you how to transfer the IIS logs to storage on a daily
basis. The IIS logs are automatically captured by default by the
diagnostic agent, so you don’t need to add them as a data source. You
can set the transfer interval to once a day with this line:
instanceConfiguration.Logs.ScheduledTransferPeriod = TimeSpan.FromDays(1.0);
Any log files that are
captured are sent to a container in BLOB storage, not to a table. Each
transfer results in one file in the container. A container hierarchy
similar to what you would see on the real server is created for you by
the diagnostic agent. Your IIS logs will be in a folder structure
similar to what you’re used to.
If logs that you don’t want to
transfer are collected, you can set ScheduledTransferPeriod to 0. This setting disables the transfer of any data
for that data source. We typically
do this for the Azure diagnostics log themselves, at least until
there’s a problem with the diagnostic agent itself that requires
troubleshooting.
That’s how you schedule a
transfer. Now let’s discuss how you can trigger a transfer on demand.
2. On-demand
transfer
An on-demand transfer
lets you configure a onetime transfer of the diagnostics data. This kind
of transfer gives you the ability to pick and choose what is
transferred and when. A typical scenario is you want an immediate dump
of logs because you see that something critical is happening. You can
set up an on-demand transfer in much the same way as you would a normal
transfer, although there are some differences.
In the following listing, we’re
initiating an on-demand transfer from within one of the instances, but
you can also initiate the transfer from outside the role with an
administrative application.
Listing
1. Initiating an on-demand transfer
Like in the
remote configuration example, you need to get a reference to the RoleInstanceDiagnosticManagersForRole class. This reference will let you
work with the configuration manager for each instance. In this example,
you’re going to be transferring the performance counter data over to an
Azure table  . This
transfer will include all counters you might have running from prior
configuration changes.
. This
transfer will include all counters you might have running from prior
configuration changes.
You use the OnDemandTransferOptions class to configure how the transfer should happen.
This class has several parameters that you’ll want to set. Set a time
filter at  , which
tells the agent to send over only the performance counter data that’s
been generated in the last hour. If you’re transferring a log, you can
also specify a log level filter (informational, critical, and so on).
, which
tells the agent to send over only the performance counter data that’s
been generated in the last hour. If you’re transferring a log, you can
also specify a log level filter (informational, critical, and so on).
When you start the transfers,
each instance performs its own transfer. The transfer operation is an
asynchronous operation; you start it and walk away. In most cases,
you’ll want to know when the transfers have completed so that you can
start analyzing the data. You can have the transfer agent notify you
when the transfer for an instance is complete by passing in a queue name
 . As
each transfer is started, you’ll be given a unique ID to
track. You can see the completion messages in figure 1.
Each message contains one of the unique IDs associated with each
transfer.
. As
each transfer is started, you’ll be given a unique ID to
track. You can see the completion messages in figure 1.
Each message contains one of the unique IDs associated with each
transfer.
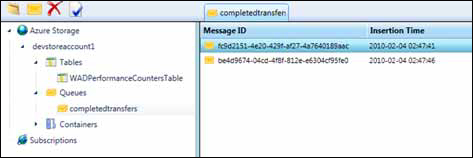
When each transfer is
complete, the agent drops a small message onto the queue you designated
with that same ID. The message lets you track which transfers have been
completed.
A great place to use an
on-demand transfer is in the OnStop method in your RoleEntryPoint override class. Whenever a role is being shut
down, either intentionally or otherwise, this method fires. If you do an
on-demand transfer in this method, you’ll save your log files from
being erased during a reboot or a move. These log files can help you
troubleshoot instance failures. Because you might not have enough time
to transfer gigabytes of log files, make sure that you’re transferring
only the critical information you need when you do this.
Now that you know how to get
data about what’s happening with your service, we need to tell you about
the APIs that’ll help you do something about what you see happening.
