Whereas Event Viewer allows you
to monitor system and application events, Reliability and Performance
Monitor (RPM) allows you to monitor and log the reliability and
performance of your computer. This is the new, upgraded version of the
old PerfMon tool that has been around since the NT days.
RPM has three
monitoring tools:
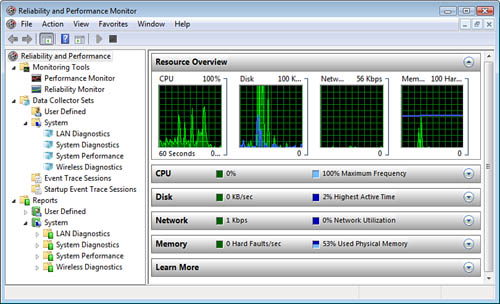
Resource View— Provides a quick look at CPU, disk, network, and
memory utilization in real time.
Performance Monitor— Uses collections of counters (a Data Collector Set)
to monitor and log specific resource components in real time or in
written logs, for historical review and analysis.
Reliability Monitor— Monitors and logs software, operating system,
and hardware failures to present an overview of the system’s stability
over time.
The RPM tool can be accessed
in Administrative Tools. The main dialog box for RPM is shown in Figure 1.
Data Collector Sets
(DCSs)
The actual data
collection and logging is performed by using Data Collector Sets (DCSs).
Note
Data Collector Sets Versus Event Forwarding Collector Don’t confuse the Data Collector Sets in RPM with
the Event Forwarding Collector computer.
Exam Alert
There are several preconfigured System Data Collector Sets.
They include
LAN Diagnostics
System Diagnostics
System Performance
Wireless Diagnostics
These
tools provide a fast and easy way to collect information on the main
system functions.
You can also create your own
DCSs to log any combination of performance counters available on the
system. Additional performance counters may get added to the system over
time as you add features and services and install applications on the
computer. A sample, custom Data Collector Set is shown in Figure 2.
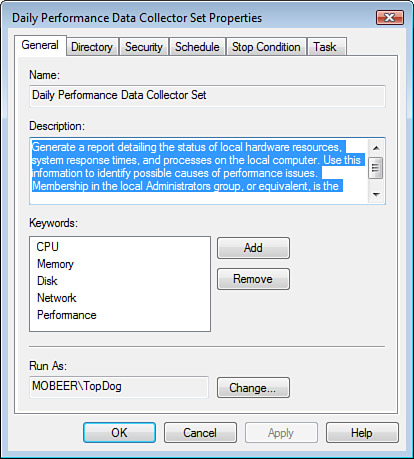
On the General tab, you can
describe the details of your custom DCS and configure the credentials
for running the log. On the Directory tab, you can configure where the
log files are written to, as well as the format for the naming
convention used for the DCS log files. The Security tab is the place
where you can configure who can access and modify the DCS parameters.
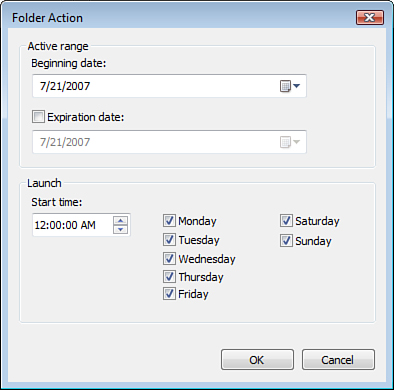
The Schedule tab is the place where you configure the Start conditions
for the DCS. The Schedule tab is shown in Figure 3. You’ll notice that you can schedule the collector to run on a
daily basis, and you can add multiple schedules.
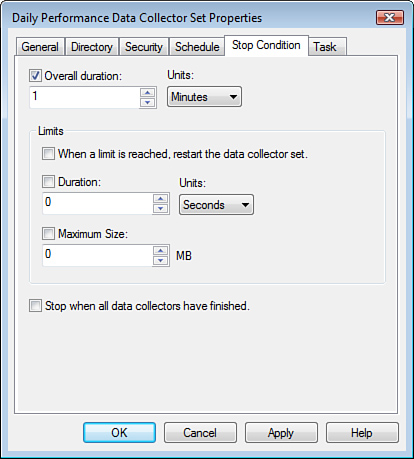
The Stop Condition tab is the place where you
configure what terminates the DCS. The stop condition can be an amount
of time or some number of megabytes consumed by the log file. This tab
is shown in Figure 4.
Finally, the Task tab allows
you to configure an executable or script to run when the DCS stops. This
integrates with the Task Scheduler to perform the launching of the
specified task.
Alert
The output from RPM can be
reviewed in the RPM tool, or it can be exported into a SQL database.
This would usually be done when there is a large number of systems being
logged with lots of data, and a more detailed analysis is required.
The
tool to use to convert the standard log file into one compatible is an
executable called Relog.exe, included
with Windows Vista. This tool allows you to adjust the counters (only
for fewer counters, of course), adjust the sampling rate of the logged
data (only for larger intervals, of course), and lets you change the
file format into binary log files (.BLG), comma-separated value
log files (.CSV), and files compatible with SQL. (.CSV files can be imported into spreadsheet
applications and databases like SQL or MS Office Access.)
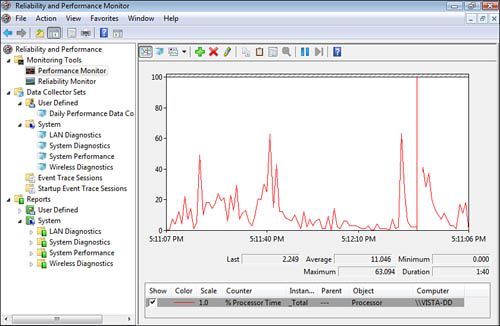
The Performance Monitor
The Performance Monitor, shown in Figure 5, is a real-time display of system resources. Using the
Performance Monitor, just like a DCS, you configure specific counters to
monitor and display. This tool does not record any information. When
the data is overwritten by the next pass of the timer mark, the data is
lost forever. If you need to keep a record of the data for later review,
you must use a Data Collector Set that generates a written log file.
In general, there are four
main resource targets for monitoring:
RAM— Monitor Pages Per Second. This value should be
less than 20 (average). If it is greater than 20, the system needs more
RAM.
CPU—
Monitor Percent Processor Time. This value should
be less than 70–80% (average). If it is greater than 70%, add a faster
CPU, add a second CPU, or move some processes to a less loaded system.
Disk
Subsystem— Monitor Percent Disk Time.
This value should be less than 50% (average). If it is greater than 50%,
add a faster disk, add a faster disk array (RAID 0 or RAID 5), or move
some accessed content to a lesser used disk.
Network Subsystem— Monitor Bytes Total per Second. This value should
be less than 6MB/s (average). At 6MB/s, the NIC is occupying about 50%
of a 100Mbps network. This is too much. If it is greater than 6MB/s,
figure out what is sending and/or receiving over the network. You’ll
probably find that the problem is really that the NIC is failing and
should be replaced.
The Reliability Monitor
The Reliability
Monitor tracks application, operating system, and hardware failures to
present a trend analysis of system stability. The Reliability Monitor is
shown in Figure 6.
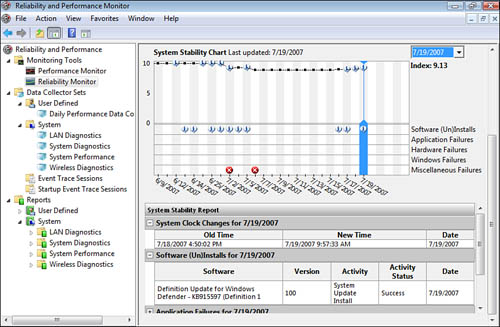
The Index rating in the
upper-right corner is an indication of the reliability and stability of
the system. You can select any incident on the calendar chart and review
details of the incident.
