OpsMgr is a sophisticated
monitoring system that effectively allows for large-scale management of
mission-critical servers. Organizations with a medium to large
investment in Microsoft technologies will find that OpsMgr allows for an
unprecedented ability to keep on top of the tens of thousands of event
log messages that occur on a daily basis. In its simplest form, OpsMgr
performs two functions: processing monitored data and issuing alerts and
automatic responses based on that data.
The
model-based architecture of OpsMgr presents a fundamental shift in the
way a network is monitored. The entire environment can be monitored as
groups of hierarchical services with interdependent components.
Microsoft, in addition to third-party vendors and a large development
community, can leverage the functionality of OpsMgr components through
customizable monitoring rules.
OpsMgr provides for
several major pieces of functionality, as follows:
Management packs— Application-specific monitoring rules are
provided within individual files called management packs. For example,
Microsoft provides management packs for Windows Server systems, Exchange
Server, SQL Server, SharePoint, DNS, DHCP, along with many other
Microsoft technologies. Management packs are loaded with the
intelligence and information necessary to properly troubleshoot and
identify problems. The rules are dynamically applied to agents based on a
custom discovery process provided within the management pack. Only
applicable rules are applied to each managed server.
Event monitoring rules— Management pack rules can monitor for specific
event log data. This is one of the key methods of responding to
conditions within the environment.
Performance monitoring rules— Management pack rules can monitor for specific performance
counters. This data is used for alerting based on thresholds or archived
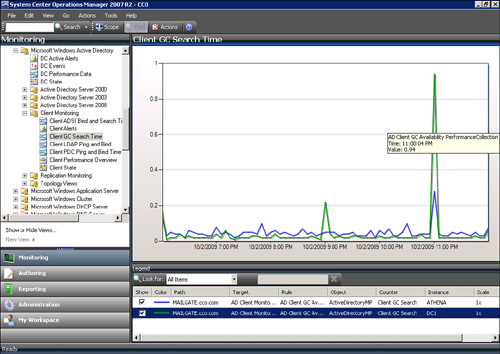
for trending and capacity planning. A performance graph shown in Figure 1 shows Client GC Search Time data for a couple of
domain controllers. There was a brief spike in latency at about 11:00
p.m., but the latency is normally less than 0.1.

State-based
monitors— Management packs contain monitors, which allow for
advanced state-based monitoring and aggregated health rollup of
services. Monitors also provide self-tuning performance threshold
monitoring based on a two- or three-state configuration.
Alerting— OpsMgr provides advanced alerting functionality
by enabling email alerts, paging, short message service (SMS), instant
messaging (IM), and functional alerting roles to be defined. Alerts are
highly customizable, with the ability to define alert rules for all
monitored components.
Reporting—
Monitoring rules can be configured to send monitored data to both the
operations database for alerting and the reporting database for
archiving.
End-to-end
service monitoring— OpsMgr provides
service-oriented monitoring based on System Definition Model (SDM)
technologies. This includes advanced object discovery and hierarchical
monitoring of systems.
Processing Operational
Data
OpsMgr manages Windows Server
2008 R2 infrastructures through monitoring rules used for object
discovery, Windows event log monitoring, performance data gathering, and
application-specific synthetic transactions. Monitoring rules define
how OpsMgr collects, handles, and responds to the information gathered.
OpsMgr monitoring rules handle incoming event data and allow OpsMgr to
react automatically, either to respond to a predetermined problem
scenario, such as a failed hard drive, with predefined corrective and
diagnostics actions (for example, trigger an alert, execute a command or
script) to provide the operator with additional details based on what
was happening at the time the condition occurred.
Generating Alerts and
Responses
OpsMgr monitoring rules
can generate alerts based on critical events, synthetic transactions,
or performance thresholds and variances found through self-tuning
performance trending. An alert can be generated by a single event or by a
combination of events or performance thresholds. Alerts can also be
configured to trigger responses such as email, pages, Simple Network
Management Protocol (SNMP) traps, and scripts to notify you of potential
problems. In brief, OpsMgr is completely customizable in this respect
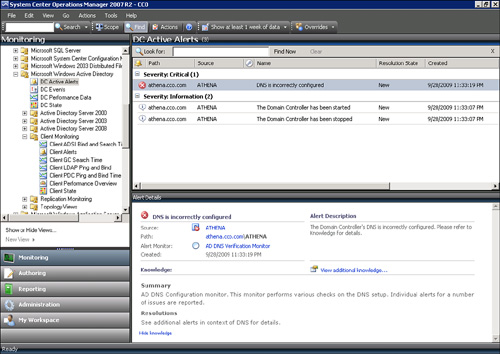
and can be modified to fit most alert requirements. A sample alert is
shown in Figure
2. The alert indicates that the domain
controller’s DNS is incorrectly configured. Also note that there are two
information alerts shown, indicating that the domain controller stopped
and started.
