MorphX has two visual designers, one for forms and
one for reports, that allow you to drag controls onto the design surface
in WYSIWYG fashion. IntelliMorph determines the actual position of the
controls, so you can’t place them precisely.
You can override these
layout restrictions by changing property values, such as Top, Left,
Height, and Width, from Auto to a fixed value, allowing the visual
designers to lay out the controls. However, doing so interferes with the
automated layout attempted by IntelliMorph, which means that there is
no guarantee that your forms and reports will display well when
translated, configured, secured, and personalized.
It is a best practice to let IntelliMorph control all the layout. Most forms and reports that ship with
Dynamics AX are designed by using the AOT. When the visual designer is
opened, a tree structure of the design is displayed, making it fairly
simple to add new controls to the design. You can either drag fields or
field groups from the data source to the design or right-click the
design and choose New Control.
Note
IntelliMorph
and MorphX treat form and report designs as hierarchical structures. A
control can be next to another control or inside a group control. This
arrangement makes a lot of sense for business applications. If you
require controls to be on top of one another, you must use absolute
pixel positions. The order of the controls in the AOT mandates the
z-order—that is, the order in which controls are virtually stacked in
the display. |
You can use a
Report Wizard, accessed from the Microsoft Dynamics AX drop-down menu at
Tools\Development Tools\Wizards, to help you create reports. The wizard
guides you through the process step by step, allowing you to specify
data sources, sorting, grouping, layout, and other settings before
producing a report in the AOT.
Visual Form Designer
The
designers can be helpful tools for learning how the IntelliMorph layout
scheme works. If you have the Visual Form Designer open when you start
designing a form, you immediately see what the form will look like, even
when it is modified in the AOT. In fact, after creating a few forms,
you’ll probably feel so confident of the power of IntelliMorph and the
effectiveness of designing forms in the AOT that you’ll only rarely use
the Visual Form Designer.
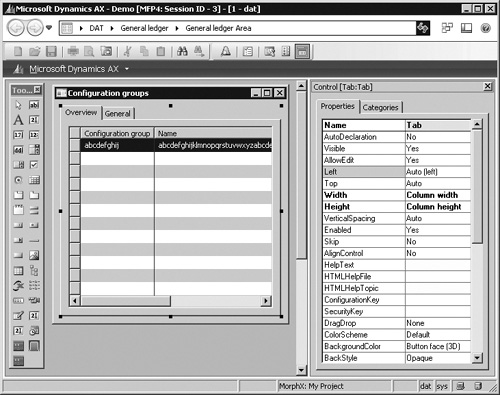
You open the Visual
Form Designer by right-clicking a form’s design in the AOT and selecting
Edit. The designer is shown in design mode in Figure 1.
Next to the form is a toolbar with all the available controls, which
can be dragged onto the form’s surface. You can also see the property
sheet showing the selected control’s properties.
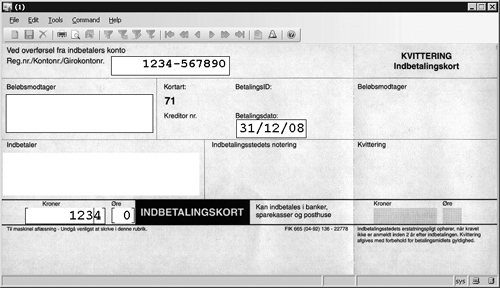
One interesting form that overrides IntelliMorph is the form tutorial_Form_freeform. Figure 2
shows how a scanned bitmap of a payment form is used as a background
image for the form, and the controls positioned where data entry is
needed.
Visual Report Designer
The
majority of MorphX reports fall into two categories—internal and
external. Requirements for reports used internally in a company are
often more relaxed than requirements for external reports. External
reports are often part of the company’s face to the outside world. An
invoice report is a classic example of an external report.
Leveraging the
features of IntelliMorph, internal reports typically follow an
autodesign that allows the consumer of the report to add and remove
columns from the report and control its orientation, font, and font
size.
External reports
typically use a generated design, which effectively overrides
IntelliMorph. So for external reports, the Visual Report Designer is
clearly preferable. Often, external reports are printed on preprinted
paper containing, for example, the company’s letterhead, so the ability
to easily control the exact position of each control is essential.
You create a generated
design from an autodesign by right-clicking a design node of a report in
the AOT and selecting Generate Design. You can open the Visual Report
Designer by right-clicking a generated design and selecting Edit. As
shown in Figure 3, each control can be moved freely, and new controls can be added.
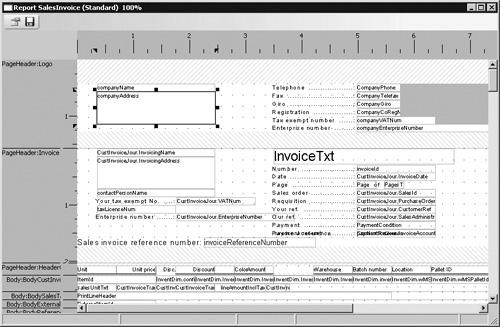
Notice the zoom setting in the lower-right corner of Figure 3.
This setting allows you to get a close-up view of the report and, with a
steady hand, position each control exactly where you want it.
The
rendering subsystem of the report engine can print only generated
designs because it requires all controls to have fixed positions. If a
report has only an autodesign, the report engine generates a design in
memory before printing.
