Apart from monitoring the performance of processing
and queries, another important activity is monitoring the overall usage
of Analysis Services. At any given point in time we might want to know
who is connected to Analysis Services and who is running queries, for
example because we might want to warn users that we're about to restart
the service for maintenance reasons. Also, in the long term, it is
interesting to know which cubes and hierarchies are used and which are
not, what type of queries are being run, who the most active users are,
which users never use the system, and so on.
To monitor usage we can use the same tools that we've used in previous sections.
Monitoring Usage with Trace Data
Collecting trace data in a SQL
Server table can be a very useful way to determine the most active
users, or the most frequent or expensive queries, over a long period of
time. The most important event to capture is Query End / MDX Query: The Duration
column for this event can be used to identify the most expensive
queries, and it allows us to see the actual MDX that was run for a
query. However, it's very often the case that users will run several
very similar MDX queries for example, they might run the same query but
slice by a different date and it is very difficult to identify this kind
of query pattern with just the MDX, so we may also choose to capture
lower-level trace events too, such as Get Data From Aggregation or even Query Subcube.
Another important piece of information in the Query End / MDX Query event is the NTUserName
column, which identifies the user who ran the query. The only issue
here is that if we are using some form of application-level security, it
might be that the same user is used for all Analysis Services queries.
In this case, we would need to create a dedicated log at the application
level because Analysis Services doesn't have enough information in the
trace to identify the end user.
Monitoring usage with Performance Monitor counters
From the Performance Monitor
counter point of view, there are specific counters that give us
information about current connections and running queries. Of course,
the entire Memory
category of counters we saw earlier also play an important part in any
usage monitoring strategy. We may also add the following counters:
MSOLAP: Connection
Current connections is the number of active client connections at the current point in time.
Current user sessions
is the number of active user sessions; a connection is always tied to a
session, but there could be sessions without active user connections.
More detailed information about which connected are available using the DMVs.
Monitoring usage with Dynamic Management Views
DMVs are very useful way to
get a snapshot of the current state of Analysis Services. As DMVs can be
queried by any client that can connect to Analysis Services, we can
build Reporting Services reports that access this information directly,
with minimum latency. For example, we can get a detailed list of active
client connections by using this command.
SELECT *
FROM $System.DISCOVER_CONNECTIONS
The result of this query
includes the user name, the client application, the date/time when the
connection started and the date/time of the last command. For each
connection there is always a user session; a list of these sessions can
be obtained with the following command.
SELECT *
FROM $System.DISCOVER_SESSIONS
In the resultset, for each
session we can see the last command issued and the current database, the
date/time when the connection started and the date/time of the last
command.
Finally, we can see a list of all currently executing commands with the following statement.
SELECT *
FROM $System.DISCOVER_COMMANDS
The resultset will contain
non-user-related activity like active traces, queries to metadata
information and so on. We will probably want to concentrate our
attention on only those commands that are consuming CPU or that are
engaged in read/write activity (the columns COMMAND_CPU_TIME_MS, COMMAND_READS, COMMAND_READ_KB, COMMAND_WRITES and COMMAND_WRITE_KB provide this type of information).
Activity Viewer
A better way to query DMVs is to
use a tool specifically designed for this purpose. Unfortunately, SQL
Server Management Studio does not have any features to do this for
Analysis Services, but there are two versions of a tool called Activity
Viewer (one each for Analysis Services 2005 and 2008), that can be used
to monitor Analysis Services state.
The first version of
Activity Viewer was designed for Analysis Services 2005 and is part of
the SQL Server Analysis Services Samples. Strangely enough, it is still
part of the Analysis Services community samples available at http://sqlsrvanalysissrvcs.codeplex.com even though it doesn't actually work on an Analysis Services 2008 instance.
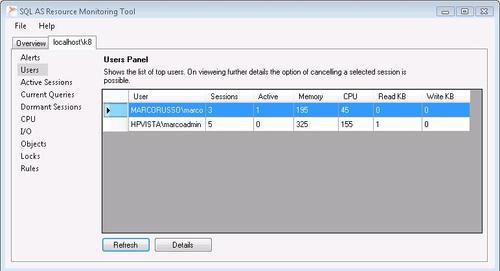
The second version, Analysis Services Activity Viewer 2008, is available at http://asactivityviewer2008.codeplex.com.
The following screenshot shows it displaying a list of users currently
connected on an instance of Analysis Services. This tool has been
improved significantly over the previous version, with new functionality
like custom alerts, which can be defined by selecting the Rules option in the left-hand pane.
Both these tools allow us to
see current connections, sessions and commands. They also allow us to
cancel a running query and this single feature makes Activity Viewer a
very important addition to any cube administrator's toolkit.
