The Microsoft Dynamics CRM
4.0 Management Pack has built-in metrics for a healthy CRM environment.
The management pack collects performance-analysis and capacity-planning
data by tracking various system metrics. This management pack has
predefined thresholds for the monitoring and alerting engine to warn
administrators of potential problems.
By managing these Microsoft Dynamics CRM
components in SCOM, administrators can quickly and accurately react to
critical events or key performance bottlenecks, and take appropriate
action to prevent Microsoft Dynamics CRM system outages.
The SCOM Management Pack monitors the following components:
Microsoft Dynamics CRM asynchronous processing service
Microsoft Dynamics CRM deletion service
Operability of ISV plug-ins
IIS - World Wide Web Publishing
Web application requests processing
Simple Object Access Protocol (SOAP) exceptions, and unexpected failures
Detects brute-force attacks and denial-of-service attacks
Microsoft Dynamics CRM database indexes
Database query processing
Installation of the Management Pack
In this section, we install the appropriate management packs for the Microsoft Dynamics CRM platform:
1. | Search for and download the Microsoft Dynamics CRM Management Pack from http://www.microsoft.com/downloads/.
|
2. | Launch Setup.
|
3. | Read and agree to the license agreement, and then click Next
|
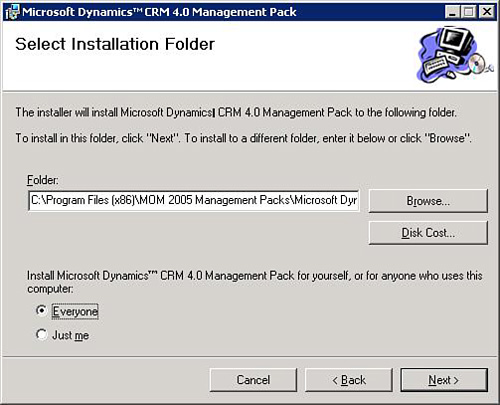
4. | Select
Everyone to ensure that the management packs are available for everyone
who is allowed to administer the SCOM system (see Figure 4).

|
5. | Click Next and then Finish to complete setup.
Note
The Microsoft Dynamics CRM Management Pack works with both MOM and SCOM 2007.
|
SCOM is a great tool for monitoring the system as a whole and can produce a consolidated view of the health of the system.
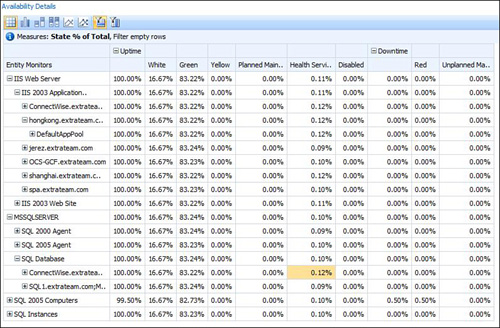
SCOM stores all the historical data, but aggregating and viewing the data in a single view can be time-consuming. Figure 5
shows a consolidated view with the uptime of the servers. The figure
shows a hierarchical view of servers, grouped by the various services
running on different servers.

Figure 6
shows server uptime. In this example, the service is not performing at
the optimal level because of server (one server) unavailability.

You can use Microsoft toolkits to build some of the dashboards and thus leverage the following systems:
SCOM 2007 R2: Monitor server health (via performance counters, event logs, and service status).
Microsoft SQL Server Database Server: Store data collected by SCOM.
Microsoft SQL Server Integration Services: Transform transactional databases into data warehouses.
Microsoft SQL Server Analysis Services: Organize SCOM data in an analytical format (dimensions, fact table, measures, and key performance indicators).
Microsoft Office SharePoint Server 2007: Provide the foundation layer to view aggregated data from many sources.
Microsoft Performance Point Services 2007: Create a presentation layer for a high-level view of the entire system.