Database monitoring
involves regularly checking the health of your databases. Typically, your monitoring
procedures are complemented by a notification system that sends alerts to
administrators when problems occur. You can use the Exchange Management Console
(EMC) and the Exchange Management Shell (EMS) to obtain database information and
statistics.
Microsoft recommends monitoring your databases on a daily basis. The main
advantages to daily monitoring are as follows:
You can quickly detect and address issues that may affect the messaging
service or data availability.
You can ensure the successful completion of specific administrative tasks,
such as daily backup operations.
It helps you meet the requirements of your Service Level
Agreements.
In this lesson, you consider how you monitor public folder and mailbox database
statistics to detect anomalies and indications of current and future problems and
how you check the status of an Exchange Server 2010 database. You also consider how
you monitor status information about mailbox database copies included in a database
availability group (DAG).
1. Monitoring Exchange Database Information and Statistics
In order to check the health of your Exchange databases and of the replication
process (if configured), you need to monitor your databases. You can obtain
general information about both public folder and mailbox databases and
statistics related to the public folders and mailboxes they contain. You can
obtain more specific information about mailboxes and mailbox databases, such as
usage information, information about queues, information about lagged mailbox
database copies, and information about disconnected mailboxes.
1.1. Obtaining Information about Mailbox Databases
When you are monitoring a mailbox database you
first need to obtain general information about the database, such as the
server where it is located, its mailbox retention period, deleted item
retention period, quota limits, associated public folder database, and so
on. You can use the Get-MailboxDatabase cmdlet to
obtain general information for mailbox databases. For example, the following
command returns detailed information about all the mailbox databases in an
Exchange 2010 organization:
Get-MailboxDatabase | FL
The previous command typically returns a lot of information that you would
likely redirect into a text file for analysis. In a large organization that
has a lot of databases, this command returns an excessive volume of
information. You have the option of refining this information by specifying
the Mailbox server, the mailbox database identity, or both. For example, the
following command returns detailed information about the mailbox database
named Mailbox Database 1363123687:
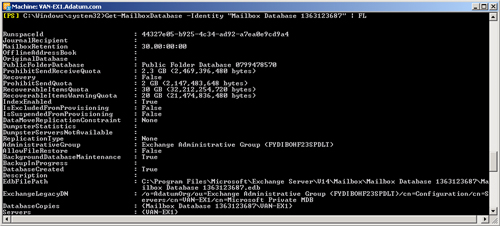
Get-MailboxDatabase -Identity "Mailbox Database 1363123687" | FL
Figure 1 shows some of
the output from this command.
You can obtain statistics (if
available) about the transport dumpster, such as dumpster deletes per
second, dumpster inserts per second, and dumpster item count by including
the DumpsterStatistics parameter, as demonstrated by the following
command:
Get-MailboxDatabase -Identity "Mailbox Database 1363123687" -DumpsterStatistics | FL
You can also determine the status of the mailbox database, if this is
available, by including the Status parameter. This tells you whether the
status of the mailbox database is one of the following: BackupInProgress,
Mounted, or OnlineMaintenanceInProgress. It also tells you the
available free space in the database root. Checking the status of mailbox
databases is an important step in monitoring replication health. The
following command uses the Status parameter:
Get-MailboxDatabase -Identity "Mailbox Database 1363123687" -Status | FL
Note:
THE DATABASE ROOT
The Extensible Storage Engine (ESE) organizes database storage in a
three-level hierarchy: database root, tables, and indexes and long
values. The database root owns all the space in the database. Tables
request chunks of space, which they then own in conjunction with the
database root. Index and long-value trees request space from a table
that in turn owns space allocated from the database root.
You can also use the EMC to determine the properties of a mailbox
database. The procedure is as follows:
On your Mailbox server, open the EMC.
Click Mailbox under Organization Configuration in the Console
tree.
In the Result pane, click the Database Management tab and then
click the mailbox database whose status you want to
determine.
Click Properties in the Actions pane.
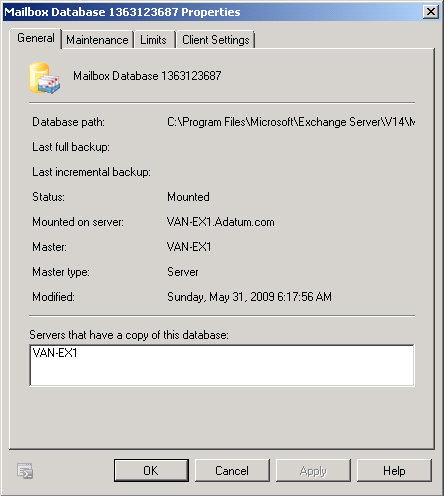
The tabs on a mailbox database Properties dialog box are General,
Maintenance, Limits, and Client Settings, as shown in Figure 2.
1.2. Viewing Mailbox Statistics
You
can use the Get-MailboxStatistics EMS cmdlet to view
the statistics for all the mailboxes on a server, for all the mailboxes in a
mailbox database, or for a single mailbox. Note that you cannot use the
cmdlet without arguments to view the statistics for all mailboxes in an
Exchange organization. The cmdlet requires the Server, the Database, or the
Identity parameter.
For example, the following command lists the statistics for all the
mailboxes on the VAN-EX1 Mailbox server:
Get-MailboxStatistics -Server VAN-EX1 | FL
The following command lists the statistics for all the mailboxes in the
mailbox database Mailbox Database 1363123687:
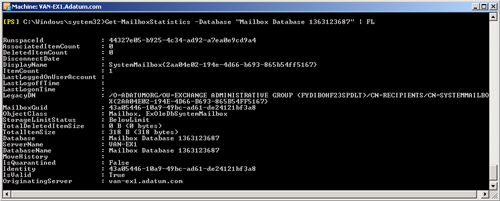
Get-MailboxStatistics -Database "Mailbox Database 1363123687" | FL
Figure 3 shows the output
from this command.
If a user mailbox has been created but has never been accessed, that
mailbox is not included when you list the statistics of mailboxes on a
server or in a mailbox database. If you attempt to obtain statistics for a
mailbox that has not been accessed, you will get no statistical information
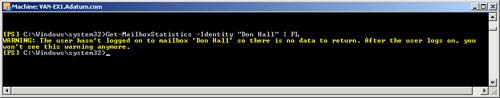
but will instead receive a warning message. Suppose, for example, that the
Don Hall mailbox has never been accessed and you enter the following
command:
Get-MailboxStatistics -Identity "Don Hall" | FL
This results in the message shown in Figure 4.
If a mailbox
returns statistics, you can use the PowerShell
format-list (FL) cmdlet to display the value of one
or more specified statistics. This is more convenient than searching through
the list of all the statistical values. For example, the following command
displays the last logon time for the Kim Akers mailbox:
Get-MailboxStatistics -Identity "Kim Akers" | FL LastLogonTime
You can use the Sort-Object PowerShell cmdlet to sort
the mailboxes in a mailbox database or on a Mailbox server by the value of
one or more mailbox statistics. You can do this in either descending or
ascending order and use the format-table (FT)
PowerShell cmdlet to display the results as a table. For example, the
following command lists the mailboxes in the Research mailbox database in
descending order of item count:
Get-MailboxStatistics -Database Research | Sort-Object ItemCount -Descending | FT
DisplayName,ItemCount
The following command lists the mailboxes in the Research mailbox database
in descending order of total item size:
Get-MailboxStatistics -Database Research | Sort-Object TotalItemSize -Descending | FT
DisplayName,TotalItemSize
Note:
MAILBOX SIZE
The size of a mailbox is the sum of its total item size and total
deleted item size. This is not returned directly as a statistical value.
If you want to display total mailbox sizes, you need to use a PowerShell
routine that combines the TotalItemSize and TotalDeletedItemSize
statistics for this mailbox.
If you do not want to list all the mailboxes in a mailbox database or on a
Mailbox server but instead want to list, for example, the top five mailboxes
in terms of total item size, you can pipe the results of your search into
the Select-Object PowerShell cmdlet. For example, the
following command lists the top five mailboxes in Mailbox Database
1363123687 in descending order of total item size:
Get-MailboxStatistics -Database "Mailbox Database 1363123687" | Sort-Object
TotalItemSize -Descending | Select-Object -First 5 | FT DisplayName,TotalItemSize
The following command lists the top 10 mailboxes on the Mailbox server
VAN-EX1 in descending order of item count:
Get-MailboxStatistics -Server VAN-EX1 | Sort-Object ItemCount -Descending | Select-
Object -First 10 | FT DisplayName,ItemCount
Note:
USING THE SORT-OBJECT AND
SELECT-OBJECT POWERSHELL
CMDLETS
You can use the Sort-Object and
Select-Object PowerShell cmdlets with other EMS
cmdlets such as Get-MailboxDatabase if, for
example, you want to list the top five mailbox databases on a Mailbox
server in terms of database size.
1.3. Monitoring Resource Usage
Sometimes pressure on a mailbox database can be the result of certain
users consuming a disproportionate amount of resources, such as by sending
an excessive number of large attachments to a large number of recipients. To
detect this situation, you can use the
Get-StoreUsageStatistics EMS cmdlet to generate a
report on the 25 accounts that are using the greatest amount of resources
within a mailbox database. For example, the following command returns the 25
users with the largest mailboxes in Mailbox Database 1363123687:
Get-StoreUsageStatistics -Database "Mailbox Database 1363123687"
You can also use the Get-StoreUsageStatistics cmdlet
to obtain statistics about a specific mailbox, but only if this mailbox
account is one of the 25 top resource users. Under these circumstances, the
following command would generate a report about the Kim Akers
account:
Get-StoreUsageStatistics -Identity "Kim Akers"
1.4. Using Performance Monitor Counters
You can use the Exchange Server Performance Monitor tool to monitor
counters that can indicate whether resources in your Exchange organization
are coming under stress. This is the same tool as Performance Monitor
(PerfMon) except that the Performance and Logs Alerts snap-in has been
prepopulated with a large number of Exchange-related performance counters.
You can access Exchange Server Performance Monitor from the EMC by clicking
the Toolbox node, clicking Performance Monitor, and clicking Open
Tool.
As an experienced
administrator, you should have used PerfMon on both server and client
operating systems to monitor current performance, create data records, and
generate reports. The tool provided by Exchange Server 2010 works in the
same way, but you have the option of monitoring performance counters
specific to Exchange. More than 100 MSExchange countergroups exist, each one
of which offers a significant number of counters.
You are not expected to be familiar with every counter that populates the
Exchange Server PerfMon. It is probable that no single person could list and
describe all of them. Nor can you be expected to know the acceptable values
that every counter returns. Although some countervalues exist that
definitely indicate a fault while other values indicate that a process is
operating in a satisfactory manner, absolute good or bad values are not
typical. If you want to use PerfMon counters to monitor performance, you
would normally record baseline counter values when your Exchange
organization is working in a satisfactory manner—possibly during a
quiet period, under normal conditions, and during busy times. Recording
values on a regular basis under the same conditions and comparing these to
baseline values would indicate whether performance is deteriorating over
time and help you track trends.
For example, to ensure that your mailbox databases continue to operate
efficiently, you need to check that they are being defragmented online on an
ongoing basis. Online defragmentation is a background task that operates
continuously by default. Exchange Server 2010 provides the following
performance counters for monitoring the behavior of online database
defragmentation:
MSExchange Database → Online
Defrag Average Log Bytes
Shows average size of the log records being generated by
online defragmentation
MSExchange Database → Online
Defrag Data Moves/Sec
Shows the number of times that data is moved from one page to
another by the online defragmentation process
MSExchange Database → Online
Defrag Log Records/Sec
Shows the number of times per second that data is moved from
one page to another by the online defragmentation process
MSExchange Database → Online
Defrag Page Moves/Sec
Shows the number of times that data is moved from one page to
a new page by the online defragmentation process
MSExchange Database → Online
Defrag Pages Dirtied/Sec
Shows the rate at which online defragmentation is modifying
clean database pages
MSExchange Database → Online
Defrag Pages Freed/Sec
Shows the number of pages per second that are freed from the
database by the online defragmentation process
MSExchange Database → Online
Defrag Pages Preread/Sec
Shows the rate at which database pages are read in
anticipation of future use by online defragmentation
MSExchange Database → Online
Defrag Pages Read/Sec
Shows the rate of database read operations being performed by
online defragmentation
MSExchange Database → Online
Defrag Pages Re-Dirtied/Sec
Shows the rate at which
online defragmentation is modifying database pages that already
contained modifications
MSExchange Database → Online
Defrag Pages Referenced/Sec
Shows the rate at which online defragmentation is touching
database pages
Note:
USING EXCHANGE SERVER PERFORMANCE MONITOR TO
MONITOR QUEUES
Exchange Server PerfMon can monitor a large number of Exchange-related
counters. In particular, you can use it to obtain information about
transport queues by monitoring counters in the MSExchange Transport
Queues group, such as MSExchange Transport Queues→ Active Mailbox
Delivery Queue Length, MSExchange Transport Queues→ Aggregate
Delivery Queue Length (All Queues), MSExchange Transport Queues→
Items Queued For Delivery/Sec, MSExchange Transport Queues→ Items
Completed Delivery/Sec, and MSExchange Transport Queues→ Poison
Queue Length.
1.5. Obtaining Information about Public Folder Databases
When you are monitoring a public folder database, you first need to obtain
general information about the database, such as the server where it is
located, what public folders it contains, its maximum item size, quota
limits, replication schedule, and so on. You can use EMS commands based on
the Get-PublicFolderDatabase cmdlet for this purpose.
For example, the following command gets detailed information about every
public folder database in an organization:
Get-PublicFolderDatabase | FL
Figure 5 shows some of
the output from this command.
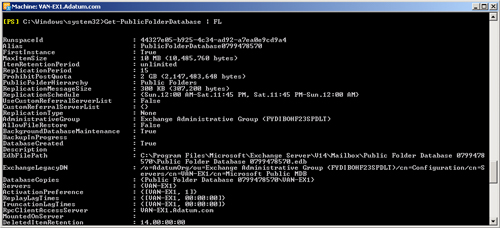
If you want to obtain detailed
information about a specific public folder database, you can specify the
Exchange Server 2010 Mailbox server on which it is located. For example, the
following command gets detailed information about the public folder database
on the VAN-EX1 server.
Get-PublicFolderDatabase -Server VAN-EX1 | FL
It is typically easier to analyze and store this information if the output
of the command is redirected to a text file. For example, the following
command redirects detailed information about the public folder database on
the VAN-EX1 server to the text file PublicFolderDetails .txt in the
DatabaseInformation folder on the VAN-EX1 server:
Get-PublicFolderDatabase -Server VAN-EX1 | FL >
C:\DatabaseInformation\PublicFolderDetails.txt
You can use the Status parameter of the
Get-PublicFolderDatabase cmdlet to obtain backup
and mount status information (if available). Checking the status of public
folder databases is an important step in monitoring replication health. The
following command gets detailed information about the public folder database
on the VAN-EX1 server, including status information:
Get-PublicFolderDatabase -Server VAN-EX1 -Status | FL
You can use the EMC to obtain information about a public folder database.
This information, such as database path, status, maintenance schedule,
replication interval, storage limits, public folder referral information,
and so on, is the same as that returned by EMS commands based on the
Get-PublicFolderDatabase cmdlet. It does not tell
you about database usage or the size and number of the public folders within
the database.
The procedure to view public folder database properties is very similar to
that for viewing mailbox database properties described earlier in this
lesson. The procedure is as follows:
On your Mailbox server, open the EMC.
Click Mailbox under Organization Configuration in the Console
tree.
In the Result pane, click the Database Management tab and then
click the public folder database whose status you want to
determine.
Click Properties in the Actions pane.
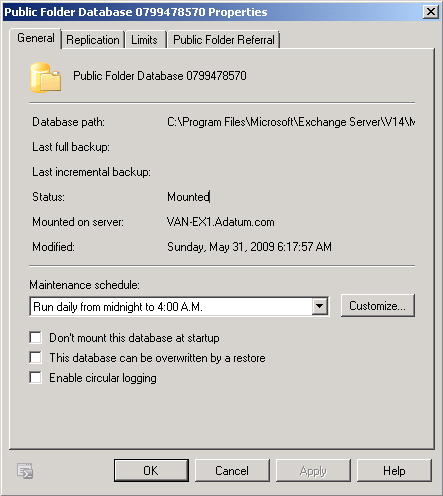
The General, Replication, Limits, and Public Folder Referral tabs
of the public folder database Properties dialog box, shown in Figure 6, show the
properties of the public folder database.
1.6. Viewing Public Folder Statistics
No EMS cmdlet exists that returns
the statistics for an entire public folder database. However, you can use
the Get-PublicFolderStatistics EMS cmdlet to obtain
statistics for each individual public folder within a public folder
database. You would, for example, obtain public folder statistics if you had
created a new public folder database on another Mailbox server and you
wanted to replicate a public folder on your current server to the new public
folder database.
You can check replication by ensuring that, for example, the number and
size of items in the public folder replica are the same as in the original
public folder. You could use the same procedure if you replicate an entire
public folder database and want to check that replication is working
correctly.
The following command obtains statistics for every public folder in an
Exchange 2010 organization:
Get-PublicFolderStatistics | FL
The previous command can return an excessive volume of information,
particularly if you have a large number of public folders. As with mailbox
databases, you can refine the information. If, for example, you want to
obtain statistics for every public folder in the public folder database on
the Mailbox server VAN-EX1, you would enter the following command:
Get-PublicFolderStatistics -Server VAN-EX1 | FL
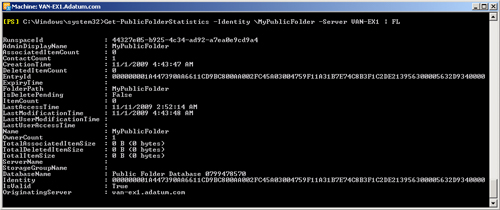
If you want to obtain statistics for the public folder MyPublicFolder on
the Mailbox server VAN-EX1, you would enter the following command:
Get-PublicFolderStatistics -Identity \MyPublicFolder -Server VAN-EX1 | FL
Figure 7 shows the output
from this command. Note that this command runs only if you have previously
created a public folder named MyPublicFolder as a child of the public folder
root.
1.7. Detecting Database Errors
Database corruption occurs, for example, when the Exchange Server Database
(EDB) file is damaged during improper server shut down, through virus
infection, or because of physical damage to the storage media. If an entire
Exchange database becomes corrupt, the ESE writes error messages to Event
Viewer, such as “Unable to read database header—database may
have moved, or data was moved or was missing during recovery” or
“Database page read failed verification because of a 1018 error (page
checksum mismatch).” You can use tools such as Eseutil and Isinteg to
repair a corrupt database or to fix database integrity problems. However,
Microsoft recommends restoring a corrupt database from backup because the
use of a tool such as Eseutil can lead to data loss.
Sometimes a database is not itself corrupt but holds items such as email
messages, which are. Corrupt email messages can cause problems with mail
flow and lead to excessive queuing. If you move an Exchange database to
another server or copy its contents to a new database, corrupt messages do
not move or copy. You can then delete such messages, typically with a
non-delivery report (NDR).
