2. Monitoring DAGs
A DAG is a set of up to 16 Exchange Server 2010 Mailbox servers that provide
automatic database-level recovery from the failure of a database, server, or
network. DAGs use continuous replication and Windows failover clustering
technologies to provide continuous mailbox availability. Mailbox servers in a
DAG monitor each other for failures. When a Mailbox server is added to a DAG, it
works with the other servers in the DAG to provide automatic, database-level recovery from database failures.
Exchange 2010 provides several built-in tools and features that are used for
regular proactive monitoring when the Exchange organization is configured for
high availability or site resilience through the creation of DAGs. The primary
tools for monitoring mailbox database copies included in DAGs are the EMS
cmdlets Get-MailboxDatabaseCopyStatus and
Test-ReplicationHealth.
Exchange Server 2010 also introduces a new event log stream that uses the
crimson channel capabilities in Windows Server 2008 and Windows Server 2008 R2
and built-in scripts that can collect data from these event channels.
2.1. Crimson Channel Event Logging
Applications and Services logs is a new category of
event logs in Windows Server 2008 and Windows Server 2008 R2. Logs in this
category store events from a single application or component rather than
events that have systemwide impact. The Applications and Services logs
category includes four subtypes: Admin, Operational, Analytic, and Debug
logs.
Typically, you would use event log records in the Admin logs subtype to
troubleshoot problems. These events typically provide guidance about what
action you should take when the event is logged. Events in the Operational
log require more interpretation. Analytic logs (hidden and disabled by
default) store events that trace an issue and, if enabled, typically log a
high volume of events. Developers use Debug logs when debugging
applications.
An application’s crimson channel contains event
logs in the Applications and Services category that are specific to that
particular application. Exchange Server 2010 has two crimson channels:
HighAvailability and MailboxDatabaseFailureItems. To view Exchange Server
2010 crimson channel event logs, carry out the following steps on the
Exchange server:
Open Event Viewer in the Administrative Tools menu.
Expand Applications and Services Logs in the Console tree. Expand
Microsoft. Expand Exchange.
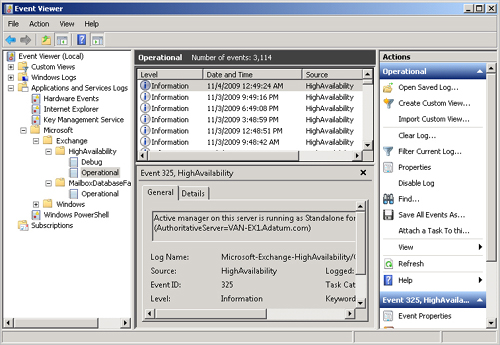
You should see two crimson channels under Exchange: High
Availability and MailboxDatabaseFailureItems. Expand High
Availability. This gives you access to the Debug and Operational
logs. Figure 8 shows the
Operational log.
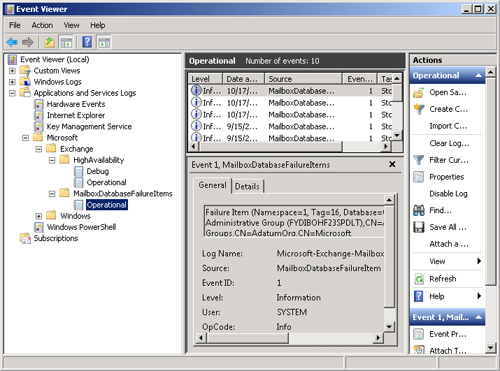
Expand MailboxDatabaseFailureItems. This gives you access to the
Operational log, shown in Figure 9.
The MailboxDatabaseFailureItems channel logs events (including failure
events) that affect a replicated mailbox database.
The High Availability channel contains events related to startup and
shutdown of the Microsoft Exchange Replication service and the components
that run within that service, such as Active Manager, the Third Party
Synchronous Replication Application Program Interface (API), the Tasks
Remote Procedure Call (RPC) Server, Tcp Listener, and Volume Shadow Copy
Service writer. Active Manager uses this channel to log events related to
Active Manager role monitoring and database action events, such as a
database mount operation and log truncation, and to record events related to
the DAG’s underlying cluster.
2.2. Obtaining the Status of Mailbox Database Copies
When you are investigating the condition of
your mailbox database copies, you typically need to determine whether the
status of a particular database copy is, for example, failed or healthy. You
can use the Get-MailboxDatabaseCopyStatus EMS cmdlet to
view status information about mailbox database copies. This lets you obtain
information about all copies of a database, information about a specific
copy of a database on a specific server, or information about all database
copies on a specific server.
For example, the following command returns status information for all
copies of a mailbox database copy named MyMailboxDatabase in an Exchange
Server 2010 organization:
Get-MailboxDatabaseCopyStatus -Identity MyMailboxDatabase | FL
Note that commands based on the
Get-MailboxDatabaseCopyStatus cmdlet also return
information about mailbox databases on a server if mailbox database copies
are not implemented. However, the status information for a mailbox database
returns fewer possible values than that for a mailbox database copy. For
example, a mailbox database that is not a copy cannot have the status
“seeding.”
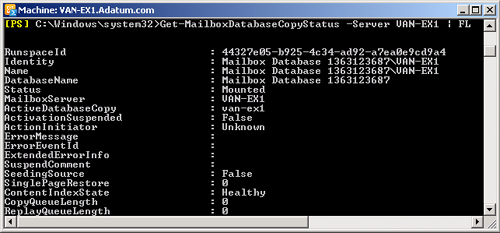
The following command returns the status for all mailbox database copies
(and mailbox databases) on a Mailbox server named VAN-EX1:
Get-MailboxDatabaseCopyStatus -Server VAN-EX1 | FL
Figure 10 shows some of
the output of this command.
The following command returns the status for all mailbox database copies
on the Mailbox server on which the command is entered:
Get-MailboxDatabaseCopyStatus -Local | FL
The following command returns the status and log shipping and seeding
network information for a mailbox database copy named MyMailboxDatabase on a
Mailbox server named VAN-EX1 :
Get-MailboxDatabaseCopyStatus -Identity MyMailboxDatabase\VAN-EX1 -ConnectionStatus | FL
Table 1 lists and describes
possible values for the copy status of a mailbox database copy.
Table 1. Mailbox database copy status
|
Copy Status
|
Description
|
|---|
|
ActivationSuspended
|
An administrator has manually blocked the mailbox
database copy from activation.
|
|
DisconnectedAndHealthy
|
The mailbox database copy is no longer connected to
the active database copy and was in the Healthy state
when the loss of connection occurred. This status
represents the database copy’s view of
connectivity to its source database copy. It may be
reported during DAG network failures between the source
copy and the target database copy.
|
|
DisconnectedAndResynchronizing
|
The mailbox database copy is no longer connected to
the active database copy and was in the Resynchronizing
state when the loss of connection occurred. This status
represents the database copy’s view of
connectivity to its source database copy. It may be
reported during DAG network failures between the source
copy and the target database copy.
|
|
Dismounted
|
Only the active copy of a mailbox database copy can
have a copy status of Dismounted. In this state, the
active copy is offline and not accepting client
connections.
|
|
Dismounting
|
Only the active copy of a mailbox database copy can
have a copy status of Dismounting. In this state, the
active copy is going offline and terminating client
connections.
|
|
Failed
|
The mailbox database copy is in a Failed state and
cannot copy or replay log files. While the database copy
is in a failed state and not suspended, the system will
periodically check to see if the problem that caused the
failed copy status has been resolved. If the system
detects that the problem has been resolved and no other
issues are causing the database copy to fail, the copy
status automatically changes to Healthy.
|
|
FailedAndSuspended
|
The Failed and Suspended states have been set
simultaneously by the system because a failure was
detected, the resolution of which explicitly requires
administrator intervention, such as if the system
detects unrecoverable divergence between the active
mailbox database and a database copy. Unlike when the
mailbox database copy status is Failed, the system does
not periodically check to see if the problem has been
resolved. Instead, an administrator must intervene to
resolve the underlying cause of the failure before the
mailbox database copy can be transitioned to a Healthy
state.
|
|
Healthy
|
The mailbox database copy is successfully copying and
replaying log files, or it has successfully copied and
replayed all available log files.
|
|
Initializing
|
The mailbox database copy status is set as
Initializing when a new database copy has been created,
when the Microsoft Exchange Replication service is
starting up or has just been started, and during
transitions from Suspended, ServiceDown, Failed,
Seeding, SinglePageRestore, LostWrite, or Disconnected
to another status. While a mailbox database copy is set
to the Initializing status, the system is verifying that
the database and log stream are in a consistent state.
In most cases, the Initializing mailbox database copy
status will last for about 15 seconds, but in all cases,
this status should not last for more than 30
seconds.
|
|
Mounted
|
Only the active copy of a mailbox database copy can
have a copy status of Mounted. In this state, the active
copy is online and accepting client connections.
|
|
Mounting
|
Only the active copy of a mailbox database copy can
have a copy status of Mounting. In this state, the
active copy is coming online and not yet accepting
client connections.
|
|
Resynchronizing
|
The mailbox database copy and its log files are being
compared with the active copy of the database to check
for any divergence between the two copies. The mailbox
database copy status will remain as Resynchronizing
until any divergence is detected and resolved.
|
|
Seeding
|
The mailbox database copy is being seeded, the content
index for the mailbox database copy is being seeded, or
both. After seeding has successfully completed, the copy
status changes to Initializing.
|
|
SeedingSource
|
In Exchange Server 2010, any healthy database or
database copy can be used as the seeding source for an
additional copy of that database. When a database is
being used as a seeding source, its copy status is
SeedingSource.
|
|
ServiceDown
|
The Microsoft Exchange Replication service is not
running on the server that hosts the mailbox database
copy.
|
|
SinglePageRestore
|
A single page restore operation is occurring on the
mailbox database copy.
|
|
Suspended
|
The mailbox database copy is in a Suspended state. You
can manually suspend a database copy by entering a
command based on the
SuspendMailboxDatabaseCopy EMS
cmdlet.
|
Note:
THE CONNECTIONSTAUS
PARAMETER
The Get-MailboxDatabaseCopyStatus EMS cmdlet also
supports the ConnectionStatus parameter, which returns details about the
in-use replication networks. If you use this parameter, two additional
output fields—IncomingLogCopyingNetwork and
SeedingNetwork—are populated in the output of the command.
2.3. Viewing the Continuous Replication Status of Mailbox Database
Copies
If you need to check all aspects of the replication and replay status of
mailbox database copies and obtain a complete overview of replication on a
specific Mailbox server in a DAG, you can use commands based on the
Test-ReplicationHealth EMS cmdlet. This functionality implements proactive
monitoring of continuous replication and the continuous replication
pipeline. It indicates the availability of Active Manager and the health and
status of the underlying cluster service, quorum, and
network components. You can run the commands locally on or remotely against
any Mailbox server in a DAG.
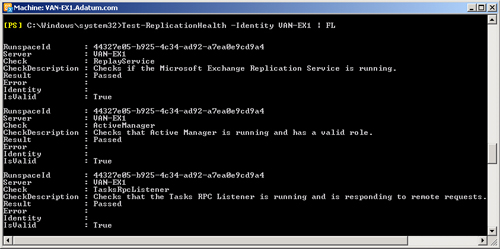
For example, the following tests replication health for the Mailbox server
VAN-EX1:
Test-ReplicationHealth -Identity VAN-EX1 | FL
Figure 11 shows the
output from this command.
The Test-ReplicationHealth cmdlet supports the
OutputObjects parameter, which enables a command that uses this cmdlet to
output an array of information regarding failures. The information returned
can include the following:
ServerName
The server on which a failure occurs
CheckID
A unique identifier for every check performed
CheckTitle
The title of the check that was run
InstanceIdentity
A unique string identifying the instance that failed (for
example, a database Global Unique Identifier [GUID])
DbFailureEventID
The Event identity (ID) of the failure event logged by the
Microsoft Exchange Replication Service for a database copy that
is in a Failed state
CheckResult
A check result (for example, pass, fail, or warning)
ErrorMessage
A failure message logged by the check for the specific failure
instance
For example, the following command tests replication health on server
VAN-EX1 and returns failure information:
Test-ReplicationHealth -Identity VAN-EX1 -OutputObjects | FL
Figure 12 shows the
output from this command. Note that if no failure has occurred, then no
failure information is recorded.
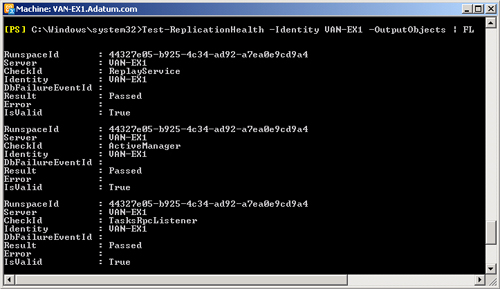
Table 2 lists and describes the
tests you can perform by using the
Test-ReplicationHealth cmdlet.
Table 2. Continuous replication status tests
|
Test
|
Description
|
|---|
|
ActiveManager
|
Verifies that the instance of Active Manager running
on the specified DAG member (or, if no DAG member is
specified, on the local server) is in a valid role
(Primary, Secondary, or Standalone).
|
|
ClusterNetwork
|
Verifies that all cluster-managed networks on the
specified DAG member (or, if no DAG member is specified,
on the local server) are available.
|
|
ClusterService
|
Verifies that the Cluster service is running and can
be reached on the specified DAG member. If no DAG member
is specified, this tests if the service is reachable on
the local server.
|
|
DagMembersUp
|
Verifies that all DAG members are up and running and
reachable.
|
|
DBCopyFailed
|
Checks whether any mailbox database copies are in a
Failed state on the specified DAG member or, if no DAG
member is specified, on the local server.
|
|
DBCopySuspended
|
Checks whether any mailbox database copies are in a
Suspended state on the specified DAG member or, if no
DAG member is specified, on the local server.
|
|
DBDisconnected
|
Checks whether any mailbox database copies are in a
Disconnected state on the specified DAG member or, if no
DAG member is specified, on the local server.
|
|
DBInitializing
|
Checks whether any mailbox database copies are in an
Initializing state on the specified DAG member or, if no
DAG member is specified, on the local server.
|
|
DBLogCopyKeepingUp
|
Verifies that log copying and inspection by the
passive copies of databases on the specified DAG member
(or, if no DAG member is specified, on the local server)
is able to keep up with log generation activity on the
active copy.
|
|
DBLogReplayKeepingUp
|
Verifies that replay activity for the passive copies
of databases on the specified DAG member (or, if no DAG
member is specified, on the local server) is able to
keep up with log copying and inspection activity.
|
|
FileShareQuorum
|
Verifies that the witness server, witness directory,
and share configured for the DAG are reachable.
|
|
QuorumGroup
|
Verifies that the default cluster group (quorum group)
is in a healthy and online state.
|
|
ReplayService
|
Verifies that the Microsoft Exchange Replication
service is running and can be reached on the specified
DAG member, or if no DAG member is specified, this tests
if the service is reachable on the local server.
|
|
TasksRpcListener
|
Verifies that the tasks RPC server is running and
reachable on the specified DAG member or, if no DAG
member is specified, on the local server.
|
|
TcpListener
|
Verifies that the TCP log copy listener is running and
reachable on the specified DAG member or, if no DAG
member is specified, on the local server.
|
2.4. Obtaining Switchover and Failover Statistics
If you are monitoring mailbox database copies, you sometimes need to
monitor when switchovers or failovers occur and how frequently this is
happening. Exchange Server 2010 provides the
CollectOverMetrics.ps1 script. This collects
information about switchover- and failover-related statistics that have
already been recorded. It is a passive monitoring script and does not
generate any new statistics. The script supports parameters that enable you
to customize the script’s behavior and output. For a full list of
these parameters, refer to the More Info link at the end of this section.
Examples of the (arguably) more significant parameters are as
follows:
DatabaseAvailabilityGroup
The DAG from which you want to collect metrics. If this
parameter is omitted, the local server’s DAG is
used.
Database
One or more databases for which the report is generated. This
parameter supports wildcards.
StartTime
The time from which
event data is collected. If this parameter is omitted, the start
time is 12:00 AM on the
preceding day.
EndTime
The time at which event data collection stops. If this
parameter is omitted, events are collected up to 11:59 PM on the preceding day.
IncludeAppLogs
Specifies if events in the Application event log should also
be collected, merged, and processed. The following providers are
included by default: MSExchangeIS, MSExchangeIS Mailbox Store,
and MSExchangeRepl.
ShowHtmlReport
Specifies that an HTML report should be displayed in a web
browser after it is generated.
GenerateHtmlReport
Specifies that the report should be output in simple HTML
table format.
For example, the following command collects metrics for all databases
whose names start with MyData in the DAG named MyDAG and generates and
displays an HTML report after the metrics are collected:
CollectOverMetrics.ps1 -DatabaseAvailabilityGroup MyDAG -Database:"MyData*"
-GenerateHTMLReport -ShowHTMLReport
This command collects metrics for all databases in a DAG named SecondDAG
and generates and displays an HTML report after the metrics are
collected:
CollectOverMetrics.ps1 -DatabaseAvailabilityGroup SecondDAG -GenerateHTMLReport
-ShowHTMLReport
Note:
RUNNING THE
COLLECTOVERMETRICS.PS1
SCRIPT
This script will not run, and an error is returned if the server on
which it is entered is not part of a DAG.
2.5. Monitoring Replication Metrics
If you need to collect and monitor metrics actively in real time, you can
use the Exchange Server 2010 CollectReplicationMetrics.ps1 script. The
script supports parameters that enable you to customize its behavior and
output. It does not have a StartTime or an EndTime parameter because it
starts immediately. Instead, you can specify a duration parameter. The
script does not support the ShowHTMLReport or GenerateHTMLReport parameters,
but you can specify Verbose to display the script output on the
screen.
For
example, the following command collects metrics for all databases in the DAG
named MyDAG and displays the collected data in an on-screen report:
CollectReplicationMetrics.ps1 -DagName MyDAG -Verbose
As with the CollectOverMetrics.ps1 script, the
CollectReplicationMetrics.ps1 script will not run if the server is not part
of a DAG.
2.6. Lagged Mailbox Database Copies
A lagged mailbox database copy is a passive mailbox
database copy that has a log replay lag time greater than zero. You can
create lagged mailbox database copies as insurance against corruption caused
by, for example, damage to the EDB file during improper server shutdown. If
you activate and recover a lagged mailbox database copy, the database
replays all log files and makes the database copy current. The database copy
thus created replaces the corrupted database. If you want to replay log
files up to a specific point in time, you need to manually manipulate log
files and run the Eseutil utility.
If you want to configure a lagged mailbox database copy of a mailbox
database, you can use the Add-MailboxDatabaseCopy EMS
cmdlet. If you specify the SeedingPostponed parameter, the new copy remains
in a Suspended state because the database needs to be seeded.
The ReplayLagTime parameter specifies the amount of time that the
Microsoft Exchange Replication service waits before replaying log files that
have been copied to the passive database copy. If you set this parameter to
a value greater than zero, this creates a lagged database copy. The
TruncationLagTime parameter specifies the amount of time that the Exchange
Replication service waits before truncating log files that have replayed
into the passive copy of the database. This time period begins after the log
has been successfully replayed into the copy of the database.
If you want to configure a lagged mailbox database copy of the database
Mailbox Database 1363123687 that is hosted on Mailbox server VAN-EX1 and you
want to configure a replay lag time of 10 minutes and truncation lag time of
two days, you would enter the following command:
Add-MailboxDatabaseCopy -Identity "Mailbox Database 1363123687" -MailboxServer VAN-EX1
-ReplayLagTime 00:10:00 -TruncationLagTime 02:00:00
If you want to change the replay lag time for the lagged mailbox database
copy Mailbox Database 1363123687 to a value of one hour, you would enter the
following command:
Set-MailboxDatabaseCopy -Identity "Mailbox Database 1363123687" -ReplayLagTime 00:01:00
