Memory plays an important role in the performance of
SQL Server. When SQL Server does not have enough memory, other
resources, such as CPU and disk IO, are often impacted. Understanding
the role of memory in SQL Server is important when monitoring your
system. In our opinion, that understanding helps you make more sense of
the monitors that you use. This section will provide a couple examples
of memory usage in SQL Server, and will show methods for determining
whether you have memory bottlenecks on your system.
1. Memory Usage in SQL Server
SQL Server uses memory to
process every query. If the data pages requested do not reside in memory
or the buffer pool, then SQL Server retrieves the pages from physical
disk and loads them. SQL Server tries to keep pages frequently accessed
in memory to minimize physical disk IO. SQL Server uses a
least-recently-used algorithm to determine the memory pages that should
be removed from memory. If you do not have enough memory to process the
requests against your system, then SQL Server will remove the frequently
accessed pages to make room to process the queries. Because of the
constant trips to physical disk, a shortage of memory will cause
increased disk IO and an increased duration for queries.
SQL Server also uses memory
for its internal structures, such as connections, execution plans, and
various SQL Server internal processes. When SQL Server is experiencing
memory problems, then there is an impact to its internal structures,
which ultimately impacts resources and SQL Server performance. Remember
that under the previous section, "SQL Server Counters That Impact CPU,"
we discussed the number of compiles in your system. Memory problems can
cause an increase in the number of compiles in SQL Server. When there is
a shortage of memory, SQL Server may decide to remove execution plans
from memory. Later, when queries that usually have compiled plans
execute, they have be recompiled, which is a CPU-intensive process.
2. Counters to Watch
Hopefully, the brief
preceding examples helped you understand how memory can impact CPU and
disk IO. This is another example of why it is important to use multiple
counters to determine what is affecting your server. If you only look at
CPU or disk IO counters, you can easily conclude that you need more CPU
or disk space when the real problem might be that you are low on
memory. Table 1 lists some of the counters that you should watch in order to keep tabs on memory utilization.
Table 1. Memory Counters and Their Recommended Values
| Counter Name | Description | Recommended Values |
|---|
| Memory: Pages Input/Sec | The rate pages are read from disk to resolve hard page faults | < 10 Pages |
| Memory: Available MBytes | The available memory on the server | > 100 MB |
| Memory: Pages/Sec | The number of pages written to or read from disk | < 100 |
| Memory: Page Faults/Sec | The average number of hard and soft pages faulted per second | Use your baseline |
| Memory: Page Reads/Sec | The rate at which pages are read from disk to resolve page faults | < 5 |
| SQL Server Buffer Manager: Buffer Cache Hit Ratio | The percentage of pages found in the buffer pool without having to go to disk | > 90 (closer to 99%) |
| SQL Server Buffer Manager: Checkpoint Pages/Sec | The number of pages per second flushed to the disk by check pointing or other methods | Use your baseline for the recommended value. |
| SQL Server Buffer Manager: Page Life Expectancy | The amount of time in seconds that pages are allowed to live in the buffer | > 300 |
| SQL Server Buffer Manager: Lazy Writes/Sec | The number of times per second that the lazy writer process moves dirty pages from buffer to disk | > 30 |
| SQL Server Memory Manager: Memory Grants Pending | The number of processes waiting for workspace memory | Should be close to zero |
| SQL Server Memory Manager: Target Server Memory | The amount of memory that SQL Server would like to have | High or rising values indicate memory pressure |
| SQL Server Memory Manager: Total Server Memory | The approximate server memory | Server RAM |
|
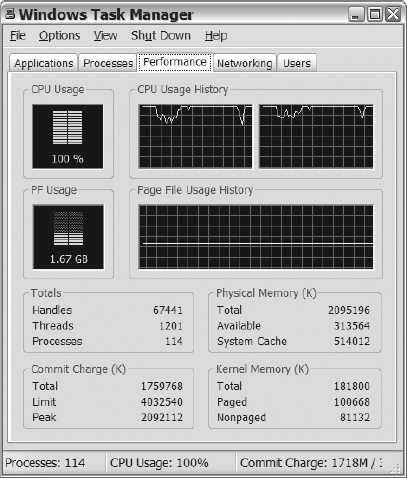
Remember that you can use the
Task Manager to monitor memory. You can quickly determine how much
memory is available by reviewing the Physical Memory section on the
Performance tab (see Figure 1).
If your available memory is less than 100 MB, then you probably should
start evaluating what is consuming your memory. In order to see what
applications are doing this, click on the Processes tab and sort the
data by the Memory Usage column. That method is useful for identifying
memory-intensive applications on your server.

|
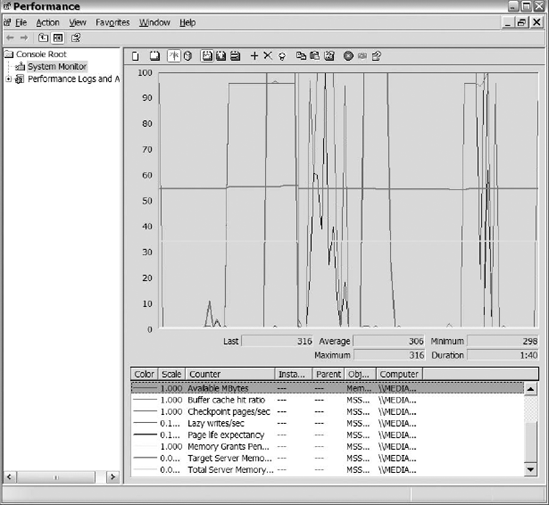
Just as with CPU counters, we like to add the counters in Table 1
to PerfMon. After adding the memory counters, we like to remove the
counters that are in line with our baseline to get rid of some of the
congestion to help us focus in on the problem areas. Figure 14-10 shows PerfMon with all the counters listed in Table 1.

3. Memory with Windows Counters
The following list explains the Memory object Windows counters listed in Table 1.
Monitoring memory counters can sometimes be a little tricky, but
familiarizing yourself with the counters you will use should help you
understand the data presented by the counters. Remember, you have your
baseline also to help you determine when performance changes within your
system.
Available MBytes:
Represents the available memory in megabytes remaining on your server.
This counter sums the amount of space on the zeroed, free, and standby
memory lists. The zeroed memory is the memory that is filled with zeros
to prevent other processes from viewing it. Free memory is the memory
ready for use by a process. Standby memory is the memory that was
removed from the processes and is waiting to go to disk. This counter
represents the last observed value, not an average value, so monitor
this value over time to ensure that you don't have minimal memory
remaining. If the server that runs SQL Server has multiple applications
running on it, you may want to consider moving those applications if
your memory is consistently less than the threshold you would like it to
be. Monitor this threshold closely because SQL Server does not perform
well when it does not have enough memory.
Page Faults/Sec:
Represents the rate of page faults per second that are occurring on
your system. This counter tracks both hard and soft page faults. Hard
page faults are faults that have to go to disk in order to retrieve the
requested data, while soft page faults retrieve the requested data in
physical memory. Because this value changes from system to system, use
your baseline to determine when the page faults rate deviates from the
norm. Do not be alarmed if you have a large number of page faults. Your
system can probably handle them without issue; however, pay close
attention to the number of hard page faults. Monitor your hard page
faults along with the physical IO counters to ensure that the hard page
faults are not causing disk IO problems.
Pages Input/Sec:
Tracks the rate of pages read from disk to resolve hard page faults.
Ideally, you do not want more than 10 pages per second read into memory
to resolve hard page faults. This counter is extremely useful when
determining the number of page faults/sec that represent hard page
faults. You can apply the following formula:
Pages input per second / page faults per second = percentage hard page faults
When the hard page faults percentage exceeds 40% for an extended period of time, the chances are your system has memory issues.Pages/Sec:
Identifies the rate of pages read from and written to disk for
resolving memory requests for pages that are not in memory. In other
words, Pages/Sec represents pages input/sec and pages output/sec. (Pages
output represents the pages removed from memory heading to disk.) A
high number in the Pages/Sec counter does not necessarily mean that you
have a memory problem. Use other counters and your baseline to help you
determine when the Pages/Sec counter is indicating a problem.
Page Reads/Sec:
Represents the rate of reads against physical disks that occurred to
resolve hard page faults. This counter captures the number of reads per
second, not the number of pages read into memory per second. Thus you
can use this counter in conjunction with the Pages Input/Sec counter to
determine the number of times the disk was read along with the number of
pages that were inserted into memory to resolve the hard page faults.
You don't want more than five pages read per second into memory.
Consider values greater than five as indicative of excessive paging.