4. Memory with SQL Server Counters
SQL Server provides a number
of performance monitor counters to help you monitor memory utilization
within SQL Server. These counters are as follows:
SQL Server Buffer Manager: Buffer Cache Hit Ratio:
Represents the number of pages found in the buffer pool without having
to read from disk. Generally, this percentage should be above 90% and
closer to 99%. SQL Server Buffer Manager: Checkpoint Pages/Sec:
The number of pages flushed to disks by checkpoints or other methods
that require the flushing of all dirty pages. Dirty pages are data pages
entered into the buffer cache, modified, and waiting for changes to
write to disk. An increasing number of checkpoints from your baseline
indicate increased activity in the buffer pool. SQL Server Buffer Manager: Page Life Expectancy:
Identifies the amount of time in seconds that pages are remaining in
memory without reference. The longer pages stay in memory, the greater
the benefit for SQL Server. If pages can stay in memory for a long time
without reference, then SQL Server will have to go to the physical disk
less often to retrieve that data. The industry-recognized time for this
counter is 300 seconds, or 5 minutes. Consistently having pages that
stay in memory for less than that amount of time may indicate the need
for more memory. SQL Server Buffer Manager: Lazy Writes/Sec:
The number of pages written to the buffer manager's lazy writer.
Frequent or an increased number of lazy writes can indicate that you
don't have enough memory. SQL Server Memory Manager: Memory Grants Pending:
Represents the current number of processes waiting for a workspace
memory grant. The workspace memory grant is the total amount of memory
dedicated to executing processes. This counter keeps track of the number
of processes that are waiting for memory before they can execute. This
counter should be as close to zero as possible. SQL Server Memory Manager: Target Server Memory:
Identifies the total amount of dynamic memory the server is willing to
consume. This number should be steady. Increasing values indicate the
need for more memory. SQL Server Memory Manager: Total Server Memory:
Represents the amount of dynamic memory that SQL Server is currently
consuming. This number should be relatively close to the maximum memory
setting for the instance.
Remember, monitoring
memory using the Windows and SQL counters may be a little tricky at
times. Some counters may exceed the recommended thresholds, while others
fit well within the ranges. Use your better judgment and your baseline
to determine when things are going wrong on your system.
5. Memory with DMVs and DBCC Commands
SQL Server also provides a
number of Dynamic Management Views and Database Consistency Checks
(DBCC) commands that you can use to monitor memory. The memory DMVs can
be a little overwhelming because there is a lot of data regarding memory
and how it's allocated within SQL Server. We are not going to talk
about all of the memory DMVs, but we will discuss some of our favorite
ones. The following list describes our most frequently used DMVs to
monitor memory:
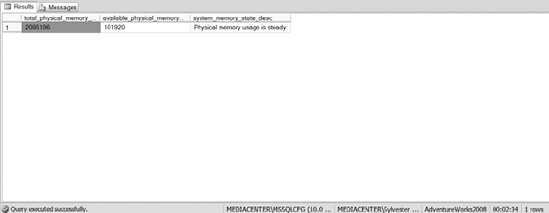
sys.dm_os_sys_memory:
Returns information regarding operating system memory. Some of the
columns include the system's total memory, the available memory, and the
total amount of page files being used. One
interesting column is system_memory_state_desc, which describes the
current state of the memory. Values returned in that column are
Available Physical Memory Is High, Available Physical Memory Is Low,
Physical Memory Is Steady, and Physical Memory Is Transitioning. You can
use the sys.dm_os_sys_memory view
when you are switching from one server to another, or from one instance
to another, to quickly see the available memory and SQL Server's
"opinion" on the amount of memory that you have available in your
system. The following query retrieves information from sys.dm_os_sys_memory. SELECT total_physical_memory_kb,available_physical_memory_kb,
system_memory_state_desc
FROM sys.dm_os_sys_memory
The results of the preceding query are shown in Figure 3.

sys.dm_os_process_memory:
Lists information about the memory used within your SQL Server
instance. Some of the columns are physical memory in use, available
commit limit, total virtual address size, and some others. This view
also has two indicators, Process Physical Memory Low and Process Virtual
Memory Low, which let you know if the virtual or physical memory is
considered low by SQL Server. Once again, this view allows you to
quickly see how memory is being used within your SQL Server instance. sys.dm_exec_query_memory_grants:
Captures information regarding the queries that are waiting or have
been given a memory grant. This DMV includes columns that tell you the
amount of requested, granted, required, maxed used, and the ideal memory
for each query running on your system. As if that information isn't
helpful enough, the DMV also returns information about the SQL handles
and plan handles so that you can see queries and their execution plans.
This view is extremely useful for identifying the memory hog queries
running on your system, analyzing their execution plans to see why they
are consuming so much memory, and fixing or providing recommendations
for fixing the queries. The
following query is one we frequently run to identify memory usage for
the queries running on our systems. The results of the query are shown
in Figure 4. SELECT session_id, request_id,requested_memory_kb,required_memory_kb,
used_memory_kb,ideal_memory_kb,sql_handle, plan_handle
FROM sys.dm_exec_query_memory_grants

You also have the ability to monitor the memory of your system by executing the DBCC memorystatus
command. This DBCC command lists memory usage for the buffer manager,
memory clerks, and a number of other processes that can consume memory
within SQL Server. Some of the information provided by the DBCC command
can be found in multiple DMVs, but the DBCC command gives you a one-stop
shop for the information you are looking for. DBCC memorystatus is also backward compatible with SQL Server 2000.
|