Estimating Access Path Cost
After the selectivity of each of the SARGs, OR
clauses, and join clauses is determined, the next phase of optimization
is estimating the access path cost of the query. The Query Optimizer
attempts to identify the total cost of various access paths to the data
and determine which path results in the lowest cost to return the
matching rows for an expression.
The
primary cost of an access path, especially for single-table queries, is
the number of logical I/Os required to retrieve the data. Using the
available statistics and the information stored in SQL Server regarding
the average number of rows per page and the number of pages in the
table, the Query Optimizer estimates the number of logical page reads
necessary to retrieve the estimated number of rows using a table scan or
any of the candidate indexes. It then ranks the candidate indexes to
determine which access path would retrieve the matching data rows with
the lowest cost, typically the access path that requires the fewest
number of logical and physical I/Os.
Note
A logical I/O occurs every
time a page is accessed. If the page is not in cache, a physical I/O is
first performed to bring the page into cache memory, and then a logical
I/O is performed against the page. The Query Optimizer has no way of
knowing whether a page will be in memory when the query actually is
executed, so it always assumes a cold cache, that the first read of a
page will be from disk. In a very few cases (for example, small OLTP
queries), this assumption may result in a slightly slower plan being
chosen that optimizes for the number of initial I/Os required to process
the query. However, the cold cache assumption is a minor factor in the
query plan costing, and it’s actually the total number of logical I/Os
that is the primary factor in determining the cost of the access path.
Clustered Index Cost
Clustered indexes are
efficient for lookups because the rows that match the SARGs are
clustered on the same page or over a range of adjacent pages. SQL Server
needs only to find its way to the first page and then read the rows
from that page and any subsequent pages in the page chain until no more
matching rows are found.
Therefore, the I/O cost estimate for a clustered index is calculated as follows:
| | Number of index levels in the clustered index |
| + | Number of pages to scan within the range of values |
The number of pages to scan is
based on the estimated number of matching rows divided by the number of
rows per page. For example, if SQL Server can store 250 rows per page
for a table, and 600 rows are within the range of values being searched,
SQL Server would estimate that it requires at least three page reads to
find the qualifying rows. If the index is three levels deep, the
logical I/O cost would be as follows:
| | 3 | (index levels to find the first row) |
| + | 3 | (data pages: 600 rows divided by 250 rows per page) |
| = | 6 | logical page I/Os |
For
a unique clustered index and an equality operator, the logical I/O cost
estimate is one data page plus the number of index levels that need to
be traversed to access the data page.
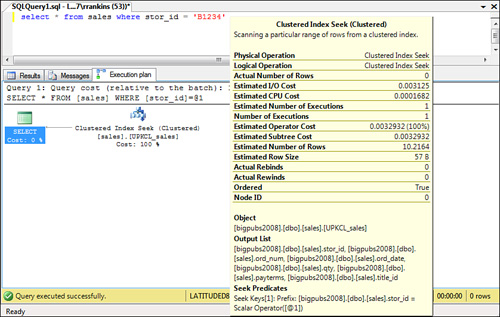
When a clustered index is used to retrieve the data rows, you see a query plan similar to the one shown in Figure 1.
Nonclustered Index Cost
When searching for values using
a nonclustered index, SQL Server reads the index key values at the leaf
level of the index and uses the bookmark to locate and read the data
row. SQL Server has no way of knowing if matching search values will be
on the same data page until it has read the bookmark. It is possible
that while retrieving the rows, SQL Server might find all data rows on
different data pages, or it might revisit the same data page multiple
times. Either way, a separate logical I/O is required each time it
visits the data page.
The I/O cost is therefore
based on the depth of the index tree, the number of index leaf rows that
need to be scanned to find the matching key values, and the number of
matching rows. The cost of retrieving each matching row depends on
whether the table is clustered or is a heap table (that is, a table with
no clustered index defined on it). For a heap table, the nonclustered
row bookmark is the page and row pointer (the row ID [RID]) to the
actual data row. A single I/O is required to retrieve the data row.
Therefore, the worst-case logical I/O cost for a heap table can be
estimated as follows:
| | Number of nonclustered index levels |
| + | Number of leaf pages to be scanned |
| + | Number of qualifying rows (each row represents a separate data page read) |
Note
This estimate assumes that the
data rows have not been forwarded. In a heap table, when a row has been
forwarded, the original row location contains a pointer to the new
location of the data row; therefore, an additional page read is required
to retrieve the actual data row. The actual I/O cost would be one page
greater per row than the estimated I/O cost for any rows that have been
forwarded.
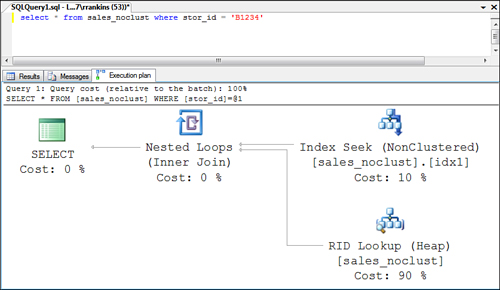
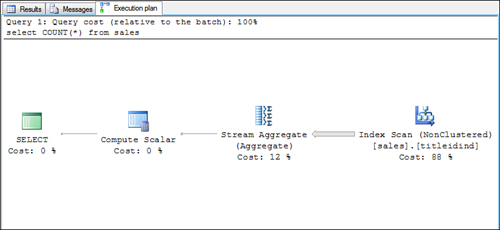
When a nonclustered index is
used to retrieve the data rows from a heap table with a clustered index,
you see a query plan similar to the one shown in Figure 2.
Notice that in SQL Server 2008, the bookmark lookup operator is
replaced by a RID lookup, essentially as a join with the RIDs returned
by the nonclustered index seek.
If the table is clustered,
the row bookmark is the clustered key for the data row. The number of
I/Os to retrieve the data row depends on the depth of the clustered
index tree because SQL Server has to use the clustered index to find
each row. The logical I/O cost of finding a row using the nonclustered
index on a clustered table is therefore as follows:
| | Number of nonclustered index levels |
| + | Number of leaf pages to be scanned |
| + | Number of qualifying rows × Number of page reads to find a single row via the clustered index |
For example, consider a
heap table with a nonclustered index on last name. Assume that the index
holds 800 rows per page (they’re really big last names!), and 1,700
names are within the range you are looking for. If the index is three
levels deep, the estimated logical I/O cost for the nonclustered index
would be as follows:
| 3 | (index levels) |
| + 3 | (leaf pages: 1,700 leaf rows/800 rows per page) |
| + 1,700 | (data page reads) |
| = 1,706 | total logical I/Os |
Now, assume that the table
has a clustered index on it, and the size of the nonclustered index is
the same. If the clustered index is three levels deep, including the
data page, the estimated logical I/O cost of using the nonclustered
index would be as follows:
| 3 | (nonclustered index levels) |
| + 3 | (leaf pages: 1,700 leaf rows/800 rows per page) |
| + 5,100 | (1,700 rows × 3 clustered page reads per row) |
| = 5,106 | (total logical I/Os) |
Note
Although the I/O cost is
greater for bookmark lookups in a nonclustered index when a clustered
index exists on the table, the cost savings during row inserts, updates,
and deletes using the clustered index as the bookmark are substantial,
whereas the couple extra logical I/Os per row during retrieval do not
substantially impact query performance.
For a unique nonclustered
index using an equality operator, the I/O cost is estimated as the
number of index levels traversed to access the bookmark plus the number
of I/Os required to access the data page via the bookmark.
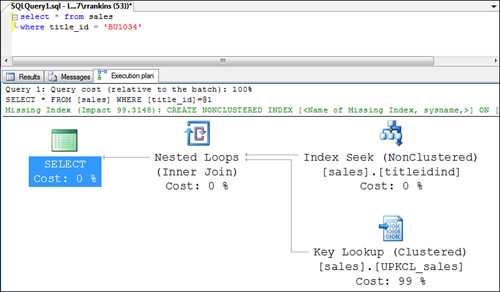
When a nonclustered index is
used to retrieve the data rows on a table with a clustered index, you
see a query plan similar to the one shown in Figure 3.
Notice that in SQL Server 2008, the bookmark lookup operator is
replaced by a clustered index seek, essentially as a join between the
clustered index and the clustered index keys returned by the
nonclustered index seek.
Covering Nonclustered Index Cost
When analyzing a query, the Query Optimizer considers any possibility to take advantage of index covering. Index covering
is a method of using the leaf level of a nonclustered index to resolve a
query when all the columns referenced in the query (in both the column
list and WHERE clause, as well as any GROUP BY columns) are included in the index leaf row as either index key columns or included columns.
Index covering can save a
significant amount of I/O because the query doesn’t have to access the
data page to return the requested information. In most cases, a
nonclustered index that covers a query is faster than a similarly
defined clustered index on the table because of the greater number of
rows per page in the index leaf level compared to the number of rows per
page in the table itself. (As the nonclustered leaf row size approaches
the data row size, the I/O cost savings are minimal, if any.)
If index covering can take
place in a query, the Query Optimizer considers it and estimates the I/O
cost of using the nonclustered index to cover the query. The estimated
I/O cost of index covering is as follows:
| | Number of index levels |
| + | Number of leaf level index pages to scan |
The
number of leaf-level pages to scan is based on the estimated number of
matching rows divided by the number of leaf index rows per page. For
example, if index covering could be used on the nonclustered index on title_id for the query in the previous example, the I/O cost would be the following:
| 3 | (nonclustered index levels) |
| + 3 | (leaf pages: 1,700 leaf rows/800 rows per page) |
| = 6 | total logical I/Os |
When index covering is used to retrieve the data rows, you might see a query plan similar to the one shown in Figure 4. If the entire leaf level of the index is searched, it displays as an index scan, as shown in this example.
Other times, if the index keys can be searched to limit the range, you might see an index seek used, as shown in Figure 5.
Note that the difference here from a normal index lookup is the lack of
the RID or clustered index lookup because SQL Server does not need to
go to the data row to find the needed information.

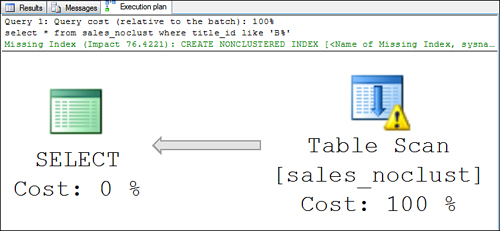
Table Scan Cost
If no usable index exists
that can be matched with a SARG or a join clause, the Query Optimizer’s
only option is to perform a table scan. The estimate of the total I/O
cost is simply the number of pages in the table, which is stored in the
system catalogs and can be viewed by querying the used_page_count column of the sys.dm_db_partition_stats dynamic management view (DMV):
select used_page_count
   from sys.dm_db_partition_stats
   where object_id = object_id('sales_noclust')
     and (index_id = 0     -- data pages for heap table
          or index_id = 1) -- data pages for clustered table
go

used_page_count
--------------------
1244
Keep
in mind that there are instances (for example, large range retrievals
on a nonclustered index column) in which a table scan might be cheaper
than a candidate index in terms of total logical I/O. For example, in
the previous nonclustered index example, if the index does not cover the
query, it costs between 1,706 and 5,106 logical I/Os to retrieve the
matching rows using the nonclustered index, depending on whether a
clustered index exists on the table. If the total number of pages in the
table is less than either of these values, a table scan would be more
efficient in terms of total logical I/Os than using a nonclustered
index.
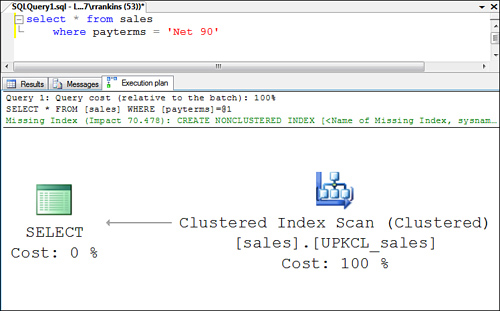
When a table scan is used to retrieve the data rows from a heap table, you see a query plan similar to the one shown in Figure 6.
When a table scan is used to retrieve the data rows from a clustered table, you see a query plan similar to the one shown in Figure 7. Notice that it displays as a clustered index scan because the table is the leaf level of the clustered index.