In addition to the robust logging mechanism, the ISA
Monitoring node also contains various tabs that link to other extended
troubleshooting and monitoring tools. Each of these tools performs
unique functions, such as generating reports, alerting administrators,
or verifying connectivity to critical services. It is, therefore,
important to understand how each of these tools work.
Customizing the ISA Dashboard
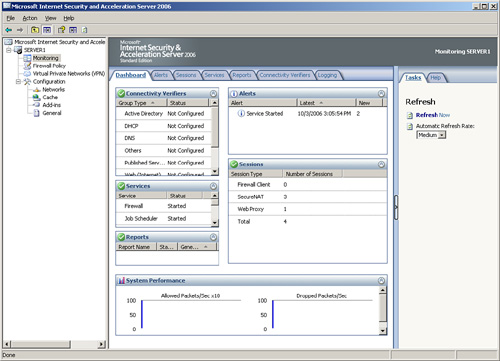
The ISA Dashboard, shown in Figure 1,
provides for quick and comprehensive monitoring of a multitude of ISA
components from a single screen. The view is customizable, and
individual components can be collapsed and/or expanded by clicking the
arrow buttons in the upper-right corner of each of the components. All
the individual ISA Monitoring elements are summarized here.

Tip
The
ISA Dashboard is the logical “parking” page for ISA administrators, who
can leave the screen set at the Dashboard to allow for quick-glance
views of ISA health.
Monitoring and Customizing Alerts
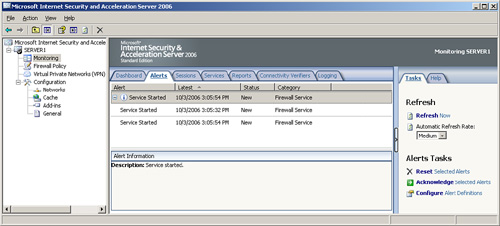
The Alerts tab, shown in Figure 2,
lists all the status alerts that ISA has generated while it is in
operation. It is beneficial to look through these alerts on a regular
basis, and acknowledge them when you no longer need to display them on
the Dashboard. If alerts need to be permanently removed, they can be
reset instead. Resetting or acknowledging alerts is as simple as
right-clicking on them and choosing Reset or Acknowledge.

Alerts that show up
in this list are listed because their default alert definition
specified an action to display them in the console. This type of alert
behavior is completely customizable, and alerts can be made to do the
following actions:
For example, it might be
necessary to force a stop of the firewall service if a specific type of
attack is detected. Configuring alert definitions is relatively
straightforward. For example, the following process illustrates how to
create an alert that sends an email to an administrator when a SYN
attack is detected:
1. | From the Alerts tab of the ISA Monitoring node, select the Tasks tab in the tasks pane.
|
2. | Click the Configure Alert Definitions link.
|
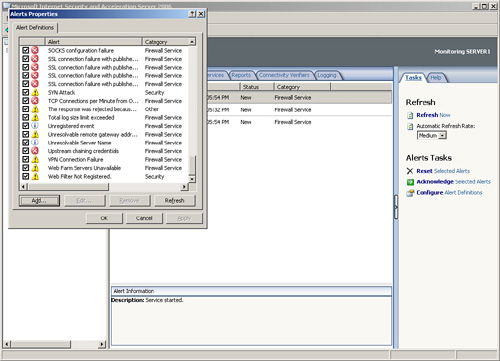
3. | On the Alert Definitions tab of the Alert Properties dialog box, shown in Figure 3, choose SYN Attack, and click Edit.

|
4. | Choose the Actions tab in the SYN Attack Properties dialog box.
|
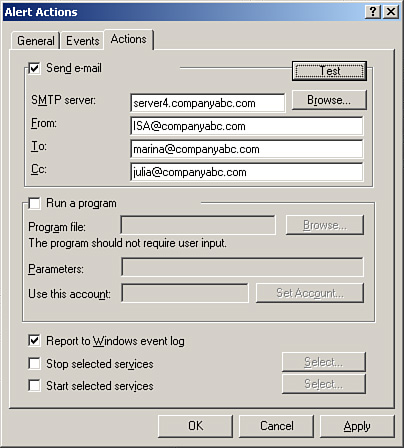
5. | Check the Send E-mail check box.
|
6. | Enter the SMTP server in the organization, and then complete the From, To, and CC fields, similar to what is shown in Figure 4.

|
7. | Click the Test button to try the settings, and then click OK to acknowledge a successful test.
|
8. | Click OK, click OK, click Apply, and then click OK to save the settings.
|
As is evident from the
list, a vast number of existing alert definitions can be configured, and
a large number of thresholds can be set. In addition, more potential
alerts can be configured by clicking Add on the Alerts Properties dialog
box and following the wizard. This allows for an even greater degree of
customization.