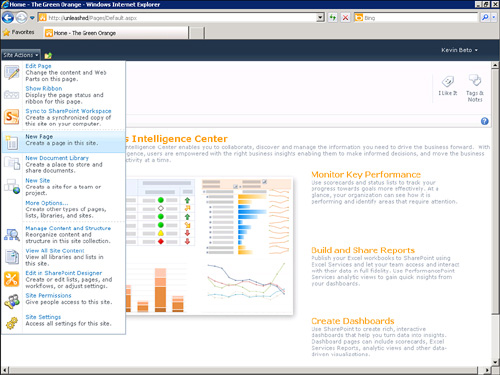
1. | In the Site Actions menu on the site you want to work with shown in Figure 1, select New Page.
|
2. | Enter a name for the new dashboard page and click OK.
|
3. | On the Insert tab, select Web Part.
|
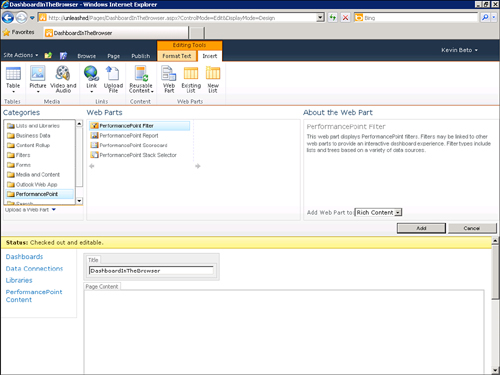
4. | Find the PerformancePoint Filter Web Part in the selection UI shown in Figure 2, and then click the Add button. Doing so adds a blank, not-yet-configured Filter Web Part to the page.
|
5. | On
the new PerformancePoint Filter Web Part that has been inserted, click
the link labeled Click Here to Open in a New Tool Pane Link to open the
Web Part Properties editing pane.
Tip
This link is available only
when the Web Part is not configured. If you need to return to this pane,
you can find it by clicking the Web Part Properties button on the Web
Part Tools – Options tab.
|
6. | At
the top of the Properties pane that appears on the right, you see a
Location edit box. Click the Browse button to the right of this box.
|
7. | Select a PPS Filter object from the SharePoint object selector, and then click OK.
Caution
There is little to no
error checking here, so it is possible to select something other than a
filter. It is even possible to select the entire list by just clicking
OK. Neither is a valid selection, and either will result in errors later
on, so make sure you have the right filter actually selected before
clicking OK.
|
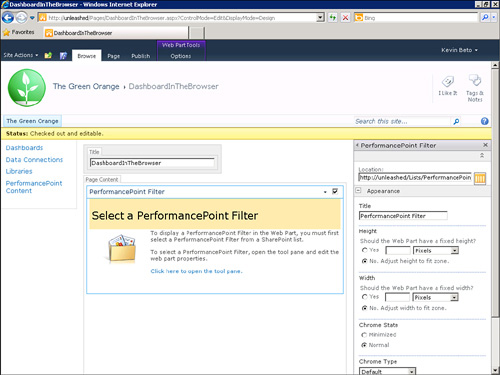
8. | At this point, your screen should look like Figure 3. Click the OK button at the bottom of the tool pane on the right to apply the changes and dismiss the tool pane.
|
9. | To
insert the Scorecard Web Part, click the Web Part button under the
Editing Tools – Insert tab, and then find the PPS Scorecard Web Part and
click Add.
Tip
If the Editing Tools –
Insert tab does not appear here, make sure your cursor selection is in
the Page Content section of this page. If the Add button does not appear
to work, make sure you have dismissed the filter’s Properties pane on
the right by clicking the OK button at the bottom of it.
|
10. | Much
like you did when configuring the filter, click the Click Here to Open
the Tool Pane link and select the scorecard you want to add to the
dashboard here. Dismiss the tool pane by clicking the OK button. The Web
Parts should both render at this point, as shown in Figure 4.

|
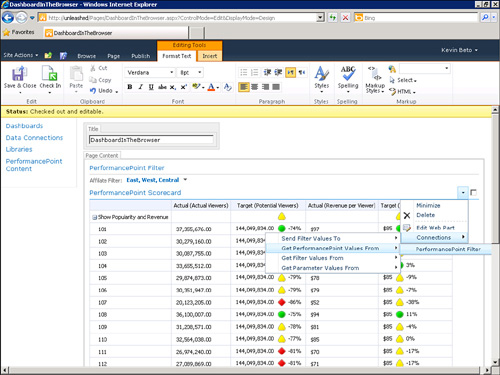
11. | Both
Web Parts work independently, but changing the filter does not affect
the values on the scorecard. Now we are going to create a connection
between the Web Parts. While hovering over the Scorecard Web Part with
your mouse, you see a down arrow appear in the upper-right corner of the
Web Part. Select the down arrow, and then select Connections, Get
PerformancePoint Values From, PerformancePoint Filter from the drop-down
menu, as shown in Figure 5.
|
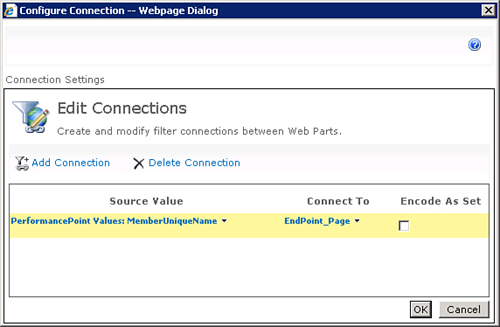
12. | The
Edit Connections dialog appears. Click the Add Connection button. Set
the Source Value to Member Unique Name and set the Connect To the
appropriate dimension or measure to filter. The dialog settings should
appear the same as Figure 6. Click the OK button to confirm this connection.
|
13. | At
this point, the Web Parts on this page are connected, and changing the
filter should adjust values in the scorecard. Click the Check In button
in the Page tab to commit your changes and make the page available for
other users of the SharePoint site. |
