Dashboards are objects in Dashboard Designer just like other PPS objects such as scorecards and KPIs.
Caution
When deploying a
dashboard, Dashboard Designer will overwrite the existing dashboard. Any
modifications done after the initial deployment will be overwritten
without warning.
If you do
accidentally overwrite a dashboard that has been modified, it is often
possible to recover it by looking at previous revisions of the page and
restoring a legacy version in SharePoint.
Creating and Deploying a Dashboard
Caution
Dashboards are ASPX pages.
Because of this, standard contributor-level permissions in SharePoint
are not enough to successfully create ASPX pages. Make sure your account
has at least Designer-level permissions on the SharePoint site with the
account deploying the dashboard.
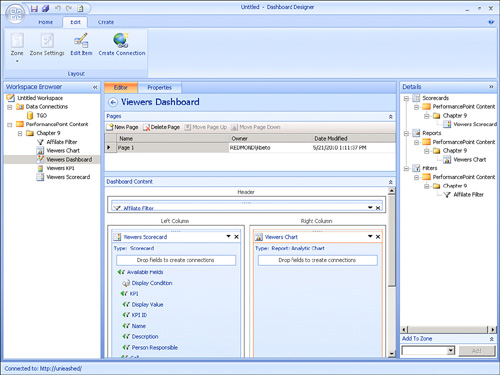
In this example, we create a dashboard using the elements shown in Figure 1. Currently, we have two reports: one KPI and one scorecard.
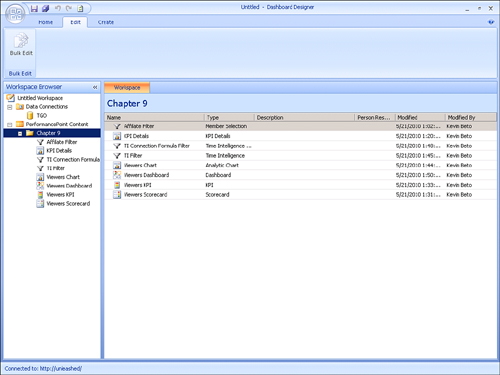
Start the process of
creating a new dashboard by clicking Dashboard on the Create tab.
Alternatively, you can right-click the list, PerformancePoint Content in
the Workspace Browser, and then select New, Dashboard, also shown in Figure 1.
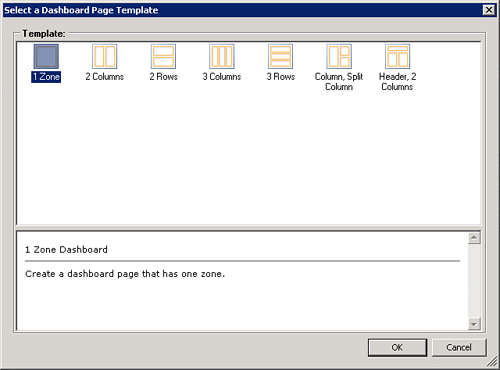
When you do this, the Select a Dashboard Page Template dialog opens (see Figure 2). From here, you choose the initial layout of the dashboard. You can modify this layout after you create the dashboard.
Each dashboard is configured with zones. Figure 3 shows a dashboard with three zones, one header, and two columns.
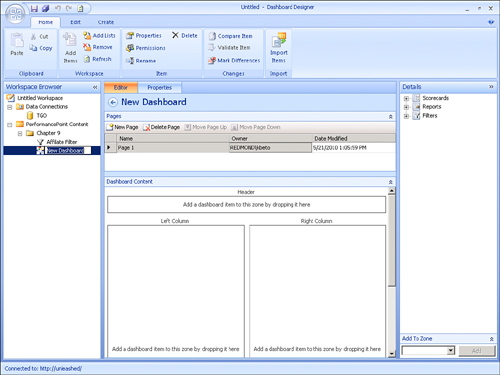
The zones define how you can
position elements, scorecards, reports, and filters on the dashboard.
The elements available are shown in the Details pane on the right side
(see Figure 4).
There are two ways to add
elements to a dashboard. In the first way, begin by choosing the item
you want to add from the Details pane. Then choose the desired zone in
the Add to Zone box at the bottom of the Details pane. Click Add to
confirm your choice. Alternatively, you can simply drag the element from
the Details pane and drop it in the desired zone.
In Figure 9.11, we have added the scorecard and one of the reports to the dashboard in the left and right columns, respectively.
Notice that we cannot
preview the dashboard at this point. You must deploy the dashboard to
SharePoint before you can see the final result.
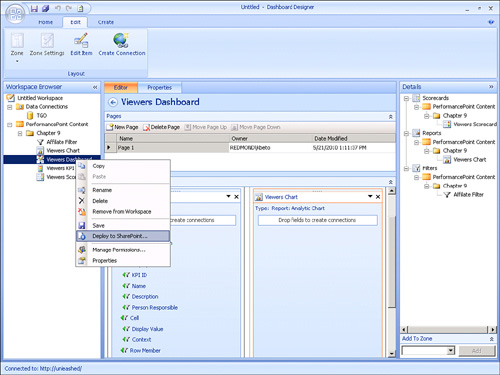
Deploy the dashboard to
SharePoint by right-clicking the dashboard in the Workspace Browser and
then selecting Deploy to SharePoint, as shown in Figure 5.
Note
In PPS 2007, you had the option
to preview the dashboard before deploying it to SharePoint. That option
is not available in PPS 2010.
Tip
You will frequently use the deployment option. The shortcut key for deploying the dashboard to SharePoint is Control+D.
The next step is to pick the document library that will store the dashboard, as shown in Figure 6. You also need to choose the master page you want to use.
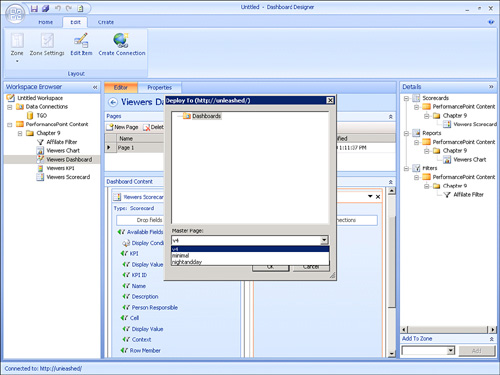
Note
Only master pages compatible
with the version 4 SharePoint UI are available for selection here. If
there is nothing available to select in this list, check that you have a
master page with this compatibility available for this dashboard
library.
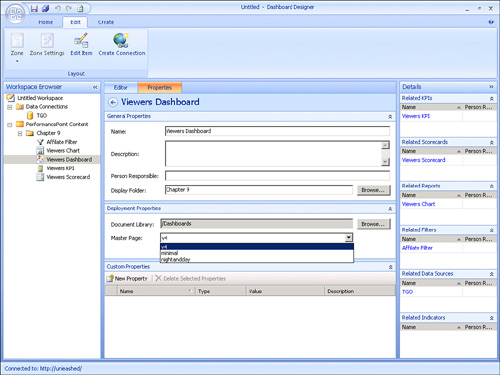
The dialog shown in Figure 6
displays only the first time you deploy a dashboard. All subsequent
deployments use those same settings. If you need to change the dashboard
target location or master page, use the dashboard Deployment
Properties, as shown in Figure 7.
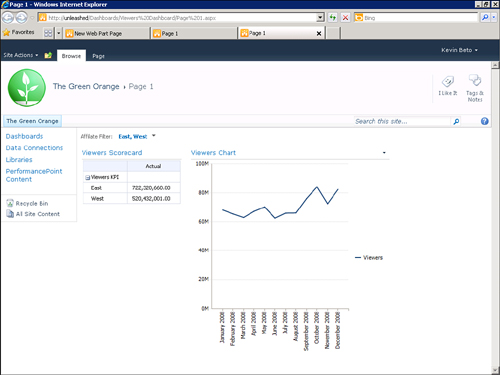
A PPS dashboard is deployed as a folder in the document library with each page becoming an ASPX file within that folder. Figure 8 illustrates what the deployed dashboards looks like.