Using the TheGreenOrange Data Source Option
Notice that we have two
additional options available: Formula and TheGreenOrange. We focus on the
TheGreenOrange option. TheGreenOrange is the name of the data source
used for this filter. If your data source is called MyDataSource, the
option would be named MyDataSource. If you want to filter your target
based on the STPS expressions you defined earlier, choose the data
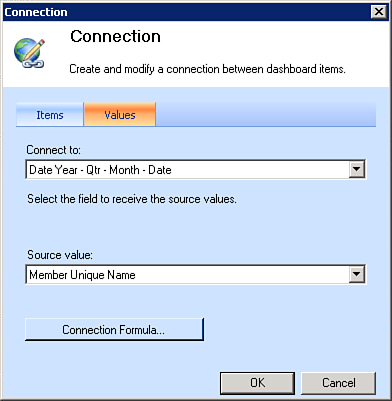
source option. In Figure 23,
we have chosen TheGreenOrange and are about to connect the filter with
the reports. When we connect a filter to a report, we get the option to
select the dimension used in the report that we want to filter. Because
we are working with Time Intelligence, we choose a dimension containing
date data.
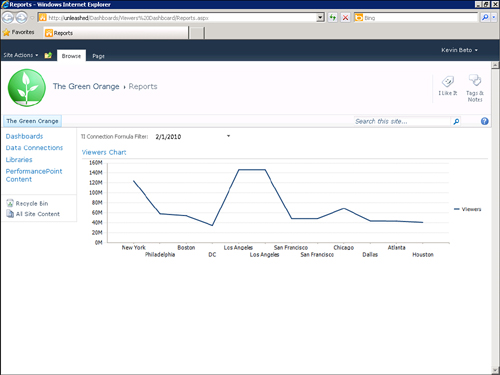
After the dashboard has been deployed, we can filter the reports using the Time Intelligence formula filter, as shown in Figure 24.
The Time Intelligence filter
is based on the current day. If we have a YTD formula and today is April
11, 2010, YTD is calculated from January 1, 2010 to April 11, 2010 and
so on. For more control over what date is considered to be “today,” you
can use a Time Intelligence Connection Formula filter template. With
this template, you have the option to select a data source that has Time
Intelligence configured, as described earlier, with the difference that
there is only one filter display option, as shown in Figure 25.
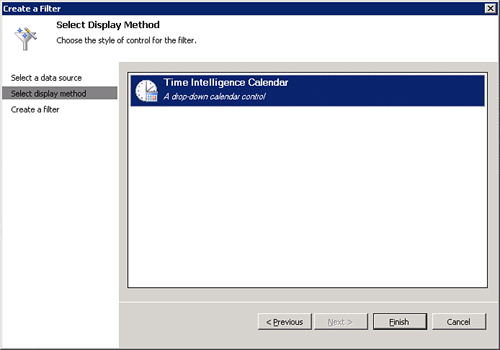
This template always shows a calendar control and allows users to choose the date that should be considered as “today.”
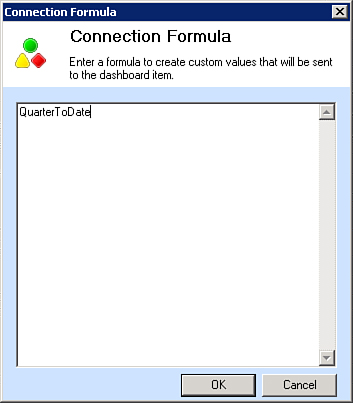
In this example, we select the
data source, TheGreenOrange. After we connect the data source with a
target, we click the Connection Formula button. In the Connection
Formula dialog, we specify the STPS expression that we want to use, as
shown in Figure 26.
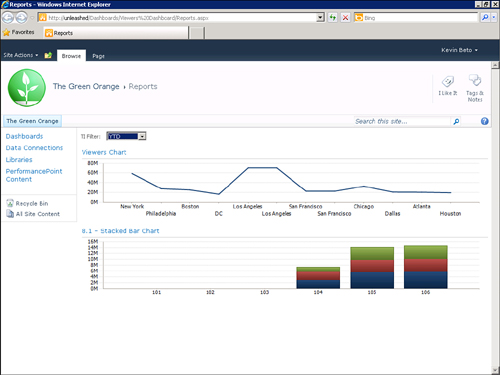
After
we deploy the dashboard, we see a calendar control, and the STPS
expression will be calculated based on the date that we pick from that
control, as shown on Figure 27.