Logo
programming4us
programming4us
programming4us
programming4us
Home
programming4us
XP
programming4us
Windows Vista
programming4us
Windows 7
programming4us
Windows Azure
programming4us
Windows Server
programming4us
Windows Phone
 
Windows Server

SharePoint 2010 PerformancePoint Services : Dashboards in Dashboard Designer (part 3) - Working with Filters on Dashboards

- Free product key for windows 10
- Free Product Key for Microsoft office 365
- Malwarebytes Premium 3.7.1 Serial Keys (LifeTime) 2019
4/12/2011 6:06:02 PM

Working with Filters on Dashboards

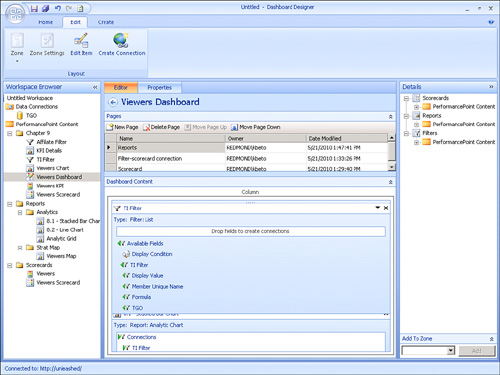
After the filter has been created, you can add it to the dashboard, as shown in Figure 16.

Figure 16. After a filter has been created, you can add it to a dashboard.

The last step is to connect the filter with either a scorecard or report on the dashboard. The filter is not going to automatically filter everything on the dashboard. You have to explicitly define what should be filtered and what filter values should be passed from the filter to its target, scorecard, or report. The available options are as follows:

  • Display Condition: When you choose this option, you are specifying that the target will not be visible until a value is chosen from the filter.

  • Display Value: When you choose this option, you are specifying that the value visible is sent to the target. A filter is going to have a name/value pair associated with each filter member. An example might be a filter showing dates. The display value would be April 11, 2010, and the value would be [Date].[Year - Qtr - Month - Date].[Date].&[1023].

  • Member Unique Name: When you choose this option, you are specifying that the unique value is being sent to the target.

In our example, we want to send the unique episode value to the scorecard as a filter value. We accomplish this by dragging the Member Unique Name item to the Drop fields to the create connections area on the scorecard. When we do this, the dialog box in Figure 17 appears.

Figure 17. When you choose to create connections, you use the Connection dialog to specify connection settings.


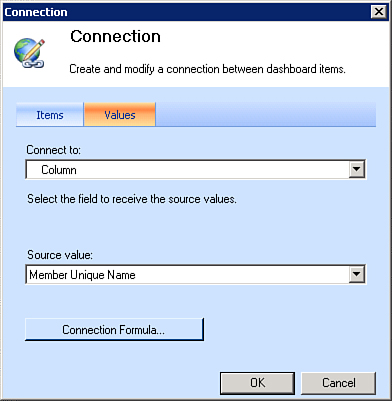
From here, we specify how we want the filter to target either a dimension or measure. These options are best explained with some visual examples.

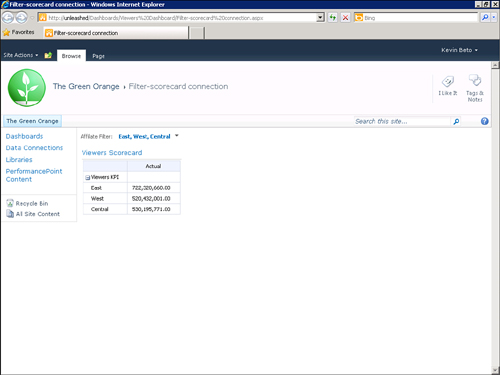
In Figure 18 we selected the Column option. Notice that the filter options we select are shown on the columns.

Figure 18. In this example, the field connection option has been set to Column.

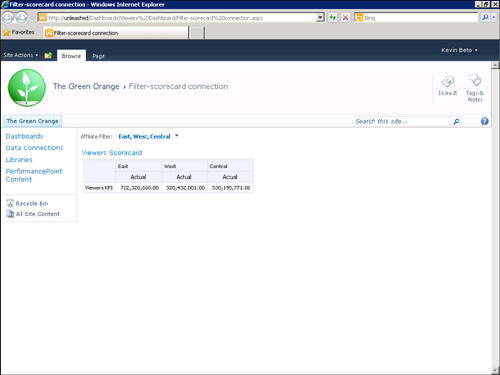
In Figure 19, the option has been set to Row.
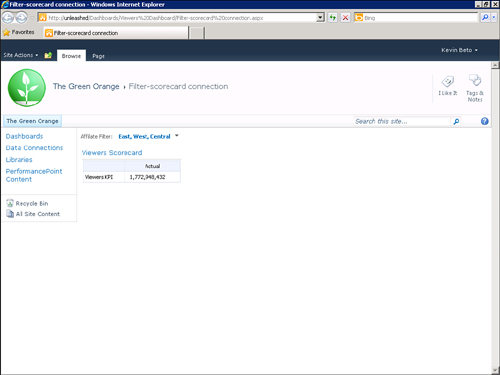
Figure 19. In this example, the field connection option has been set to Row.

In Figure 20, the option has been set to Page. Notice that we are now looking at the aggregated value of the three episodes we selected in the filter.

Figure 20. In this example, the field connection option has been set to Page.

The next example illustrates a filter based on the Time Intelligence filter template. We have started the filter creation and selected the data source already. The dialog shown in Figure 21 is where we add an STPS expression .
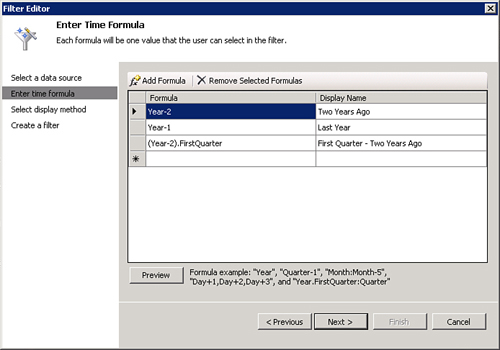
Figure 21. This is where you can add an STPS expression for a Time Intelligence filter.

In this example, we added two expressions: YTD and Yesterday. After the filter has been created, we must connect it to one or more targets. This time, we connect it to the two reports we have on the dashboard, as shown in Figure 22.

Figure 22. In this example, the filter connects to two reports.
Other -----------------
- SharePoint 2010 PerformancePoint Services : Dashboards in Dashboard Designer (part 2) - Dashboard Zones & Dashboard Pages
- SharePoint 2010 PerformancePoint Services : Web Part Connections
- BizTalk 2010 Recipes : Orchestrations - Configuring Basic Correlations
- BizTalk 2010 Recipes : Orchestrations - Using the Call Orchestration and Start Orchestration Shapes
- BizTalk 2010 Recipes : Orchestrations - Using the Transform Shape
- Windows Server 2003 : Deploying Security Configurations - Introducing Security Templates
- Windows Server 2003 : Deploying Security Configurations - Creating a Testing and Deployment Plan
- Windows Server 2003 : Hardening Servers - Deploying Role-Specific GPOs
- Empowering Users Through SharePoint 2010 Libraries (part 2) - A Brief Tour of a Document Library & Adding Documents to a Document Library
- Empowering Users Through SharePoint 2010 Libraries (part 1) - Using the View All Site Content Page in SharePoint 2010
 
 
Top 10
- Microsoft Visio 2013 : Adding Structure to Your Diagrams - Finding containers and lists in Visio (part 2) - Wireframes,Legends
- Microsoft Visio 2013 : Adding Structure to Your Diagrams - Finding containers and lists in Visio (part 1) - Swimlanes
- Microsoft Visio 2013 : Adding Structure to Your Diagrams - Formatting and sizing lists
- Microsoft Visio 2013 : Adding Structure to Your Diagrams - Adding shapes to lists
- Microsoft Visio 2013 : Adding Structure to Your Diagrams - Sizing containers
- Microsoft Access 2010 : Control Properties and Why to Use Them (part 3) - The Other Properties of a Control
- Microsoft Access 2010 : Control Properties and Why to Use Them (part 2) - The Data Properties of a Control
- Microsoft Access 2010 : Control Properties and Why to Use Them (part 1) - The Format Properties of a Control
- Microsoft Access 2010 : Form Properties and Why Should You Use Them - Working with the Properties Window
- Microsoft Visio 2013 : Using the Organization Chart Wizard with new data
 
programming4us
Windows Vista
programming4us
Windows 7
programming4us
Windows Azure
programming4us
Windows Server